Newest
Topics:
For the latest news, see the NEWEST TOPICS page.
Google is too dumb to let me put the list of news in this column and falsely claims that all my pages are self-duplicates.
Google-NONSENSE
Google's so-called "Artificial Intelligence" is an abuse of the concept of intelligence!
Fitting gaussian populations to
the Favona area decrepitation data
The decrepitation results show the total decrepitation from all
inclusion types present in the samples. Each sample usually contains
several different populations of inclusions which may be the result of
zonation during the host mineral deposition. Statistical methods can be
used to determine a group of individual gaussian curves which sum to
produce the observed decrepitation curve. For this work, I have used
the scaled Levenberg-Marquardt algorithm to derive the best fit
gaussian component populations. I use skewed gaussian population
components as it has been found that they usually produce a better fit
to the data envelope. Using the parameters of these component
sub-populations it is possible to make detailed and reproducible
temperature comparisons between samples and also to quantify the
various populations, particularly any populations in the 200 C to 400 C
range, which are typically due to the presence of CO2 rich
fluid inclusion populations.
Upper Favona vein
There were probably 6 samples collected in this area. Two sample
locations are uncertain due to suspected mis-labeling. These samples
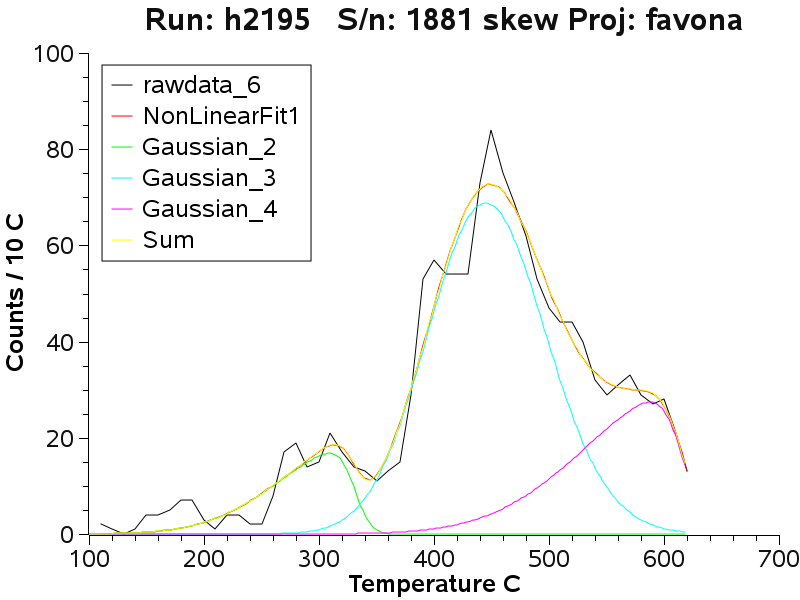
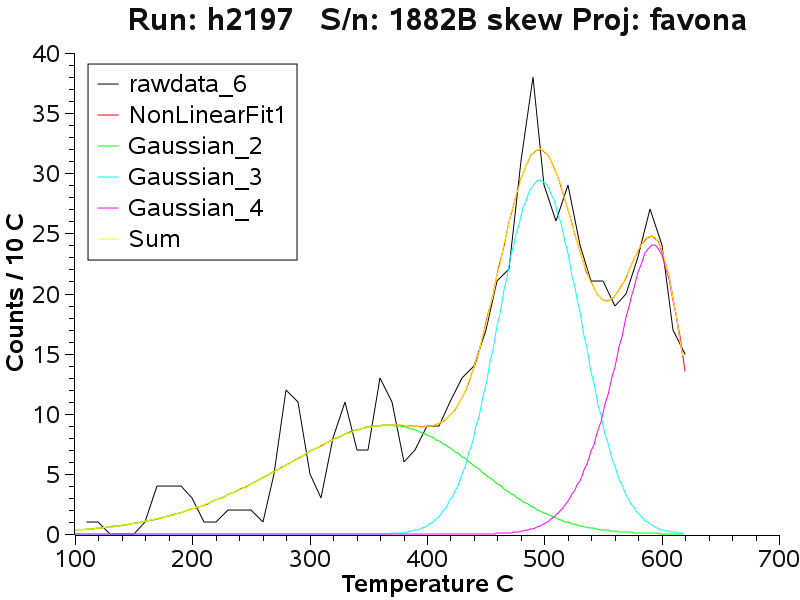
represent a high grade gold zone. Samples 1881 and 1882 had 41 g/t
gold. Both of these samples also show a peak near 320 C, even though
the data shows considerable noise on sample 1882 because the overall
decrepitation intensity was extremely low.
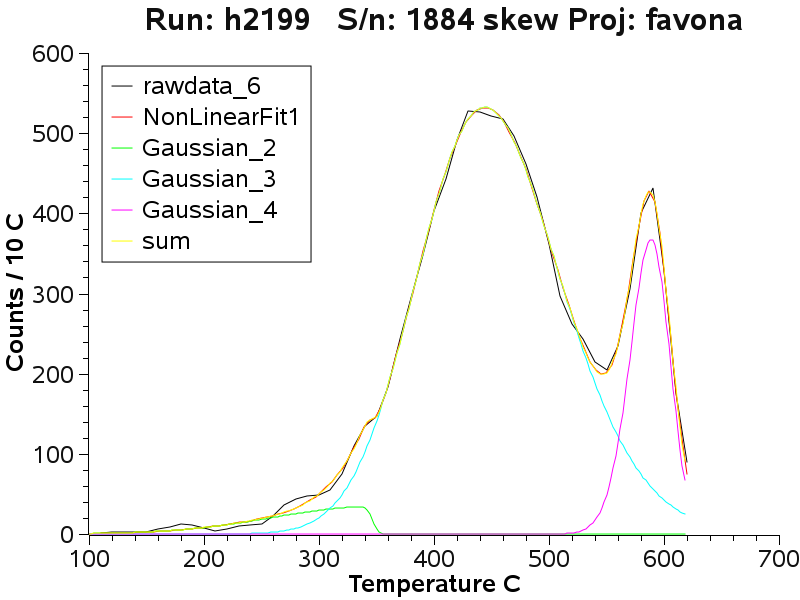
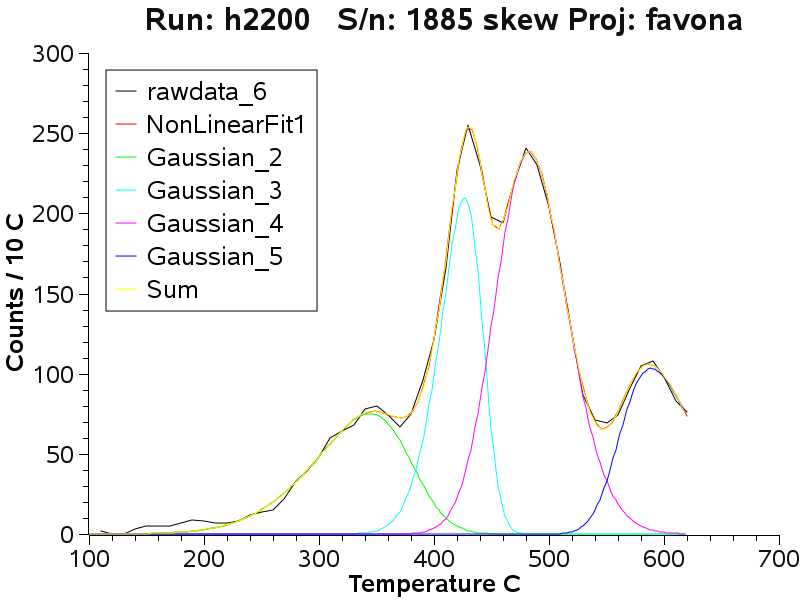
Samples 1884 and 1885 had high gold grades of 79 g/t. These
samples probably come from The upper Favona area, although they were
mislabeled during sampling and their exact location is yet to be
verified. Sample 1884 shows a prominent low temperature toe
on the main peak, and the fit algorithm suggests a separate low
temperature, highly skewed population near 320 C. On sample 1885 there
is a very prominent low temperature population near 320 C
Peak Temperatures -
Upper Favona Samples
Sample
#
No.
of Peaks
Temp
Temp
Temp
Temp
1881
3
308
446
-
588
1882
3
366
-
496
592
1884
3
336
444
-
588
1885
4
344
426
482
588
Mid-depth Favona Vein
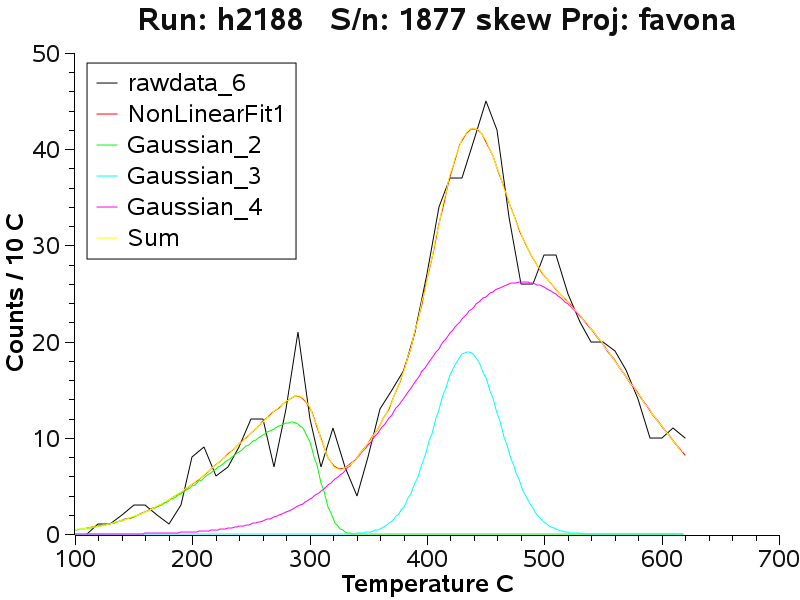
Sample 1877 was collected from deeper down in the Favona vein.
Although it has very low decrepitation intensity and a rather noisy
envelope, there is still a distinct low temperature peak caused by CO2
rich fluid inclusions. This sample has only a low Au grade near 1 g/t.
However, the presence of CO2 rich fluid inclusions suggests
that this fluid is closely related to the fluid which deposited the
high grade Au nearby, and that this location should be regarded as
potentially mineralised.
Peak Temperatures
- Mid-depth Favona Samples
Sample #
No. of Peaks
Temp
Temp
Temp
Temp
1877
3
286
434
482
-
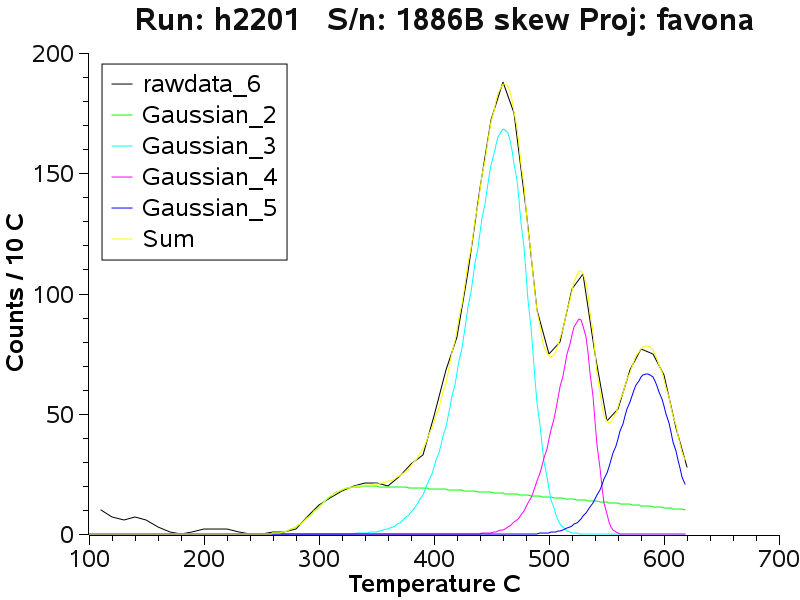
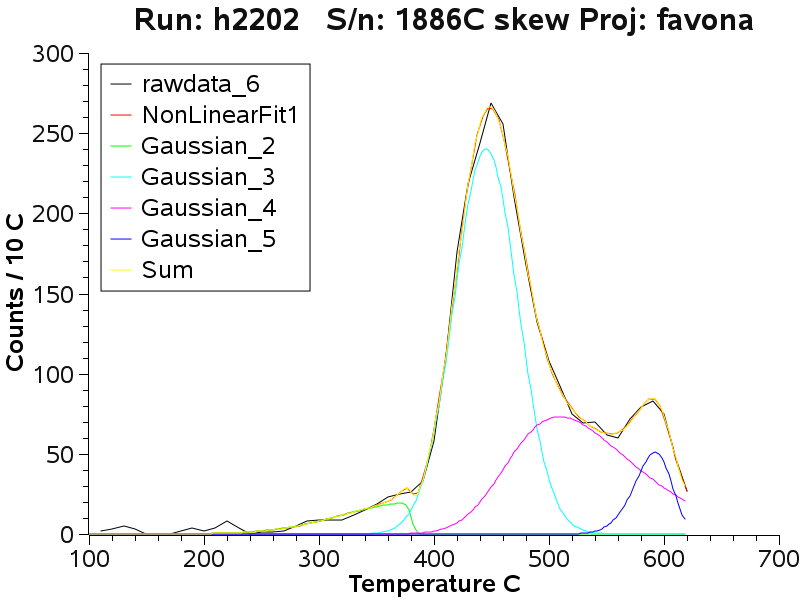
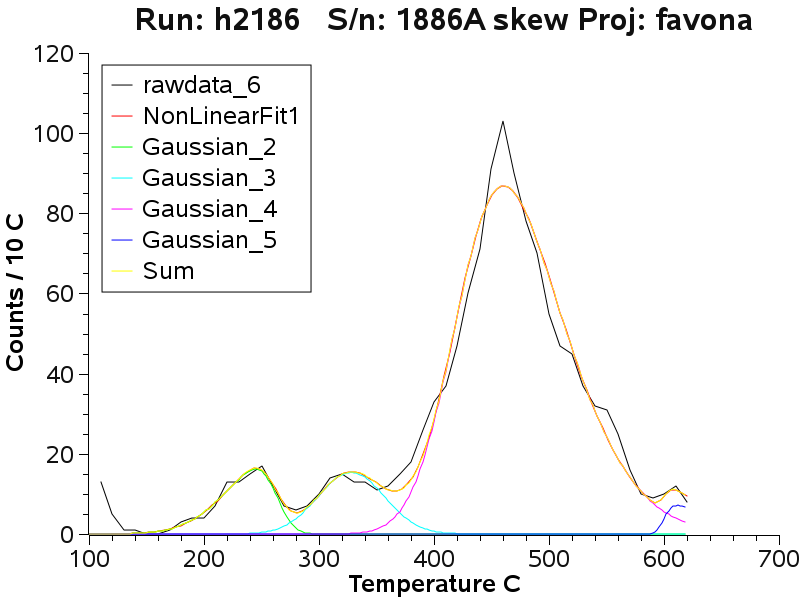
Favona South Area
Sample 1886 is from the Favona South area and contains only 0.23
g/t Au. This sample showed visible inhomogeneity and so was split
during
preparation into 3 samples. There are
significant differences between these 3 results which is typical of
strongly zoned quartz. This sample had much more intense
decrepitation, perhaps due to a higher liquid content in the
inclusions. There is also still a weak low temperature peak, perhaps
even 2 seperate peaks, caused by a
high CO2 content.
Peak Temperatures -
Favona South Samples
Sample #
No. of Peaks
Temp
Temp
Temp
Temp
Temp
1886B
4
-
342
460
526
584
1886C
4
-
372
446
510
592
1886A
4
244
328
460
-
612
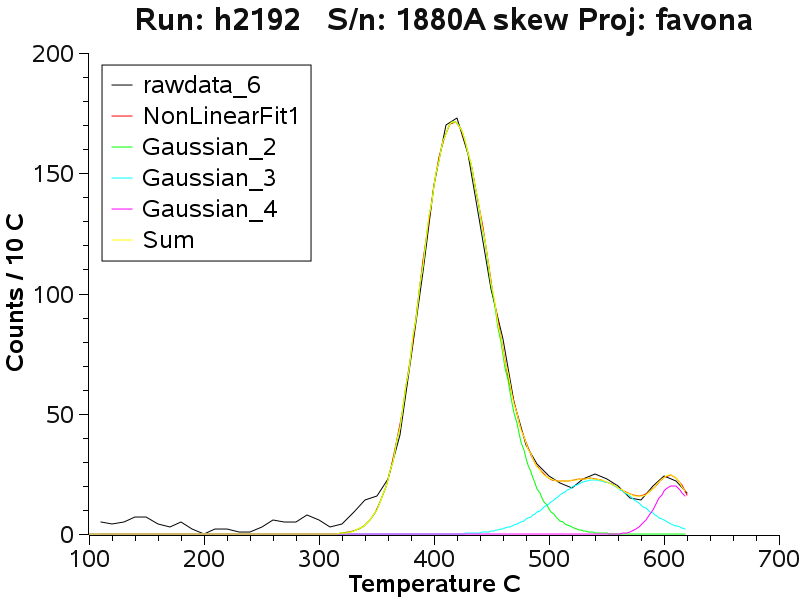
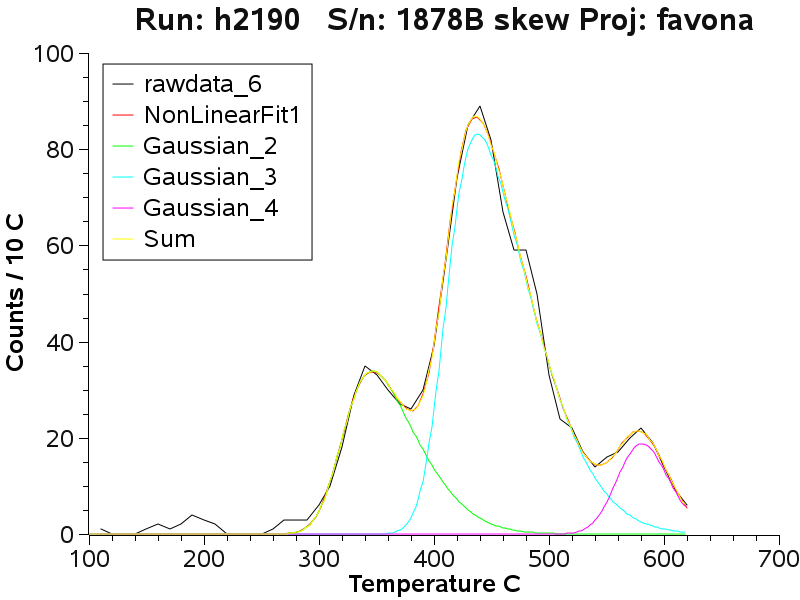
Moonlight Area
Sample 1880 and 1878 from the Moonlight area contained only
very low
Au at 0.12 g/t. One sample, 1880A, lacks the low
temperature peak and it
is interpreted that CO2 is absent from this sample. However,
sample 1878B does have a low temperature peak caused by CO2
rich inclusions.
Peak Temperatures -
Moonlight samples
Sample #
No. of Peaks
Temp
Temp
Temp
Temp
1880A
3
-
418
540
608
1878B
3
346
438
-
580
General notes on the graphs
In all these graphs, the mathematical fit curve is shown in red.
The individual component curves are also summed to generate the SUM
curve, which is plotted in yellow. In all cases the SUM curve is almost
identical to the mathematical fit and plots on top of the red curve,
giving a brown-orange colour.
 Applied Mineral Exploration