Newest
Topics:
For the latest news, see the NEWEST TOPICS page.
Google is too dumb to let me put the list of news in this column and falsely claims that all my pages are self-duplicates.
Google-NONSENSE
Google's so-called "Artificial Intelligence" is an abuse of the concept of intelligence!
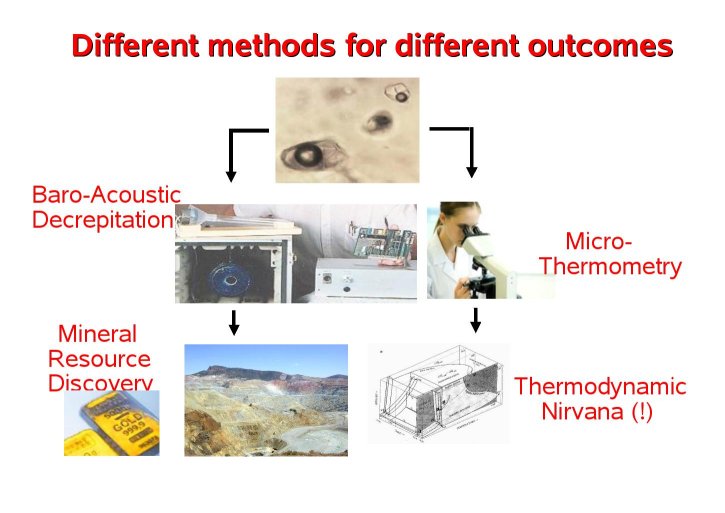
Gold Exploration using Baro-acoustic
Decrepitation
An oral presentation by K. Burlinson at the IMA congress,
Budapest, 2010
Using fluid inclusion data to locate mineral deposits
There is a vast database of geological information on hydrothermal
systems collected from fluid inclusion studies. Diabolically, this
valuable data is completely ignored by the mineral exploration
community when they are exploring for hydrothermal mineral deposits.
In
part, this is due to misinterpretations and wrong conclusions drawn
on
some early work in the 1950's. At that stage there was almost no
understanding of the importance of gases in hydrothermal fluids and
no
understanding at all on the thermodynamics of gas-water mixtures and
how they would affect fluid inclusion decrepitation. This led to
completely incorrect conclusions about the decrepitation method and
its
subsequent disuse in western countries. However the method remained
in
use in soviet Russia through the 1970's and 1980's and also in
China to the present day as an exploration technique.
We are now well aware of the importance and almost ubiquitous
presence of gases including CO2 and CH4
in hydrothermal fluids and have a well developed understanding of
the
thermodynamic behaviour of such fluids, which leads to the
realisation
that we can use the baro-acoustic decrepitation method as a mineral
exploration technique to identify samples with abundant gas-rich
fluid
inclusions. Such gas rich fluid inclusions are well known to be
closely
associated with many economic hydrothermal mineral deposits,
particularly gold. Using this method we can analyse many samples in
a
large spatial array and map out contours of fluid inclusion gas
contents to define anomalous areas of potential mineralisation.
The baro-acoustic decrepitation method is particularly appropriate
as a
mineral exploration technique as the analyses are quick and sample
preparation is minimal, leading to a low cost per sample for the
analyses and a fast turn-around time. The sample needs only to be
crushed and sieved and there is no need for the costly and slow
preparation of doubly polished thin sections. The entire analysis is
performed in about 30 minutes by a computerised instrument which is
completely objective and gives consistent and reproducible results.
There is no need for any microscope work or the subjectivity that
would
entail.
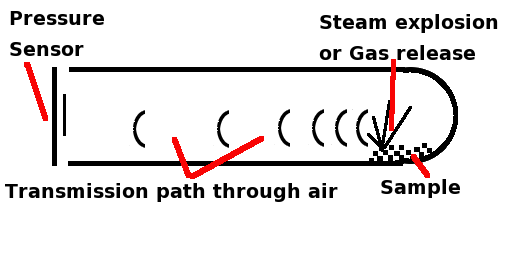
The baro-acoustic decrepitation method detects ONLY the pressure
pulses
from fluid inclusions when they burst open due to their high
internal
pressures as they are heated. There have been incorrect comments
that
the method detects crystallographic effects rather than fluid
inclusions. But such crystallographic changes in the sample generate
shear (S) waves in the solid grains which cannot reach the pressure
sensitive detector as shear waves cannot traverse the airpath (a
fluid)
which separates the sample from the detector. The detector only
counts
pressure pulses transmitted as P waves caused by release of high
pressure gases or steam explosions from superheated water as fluid
inclusions decrepitate. (Additional
discussion here)
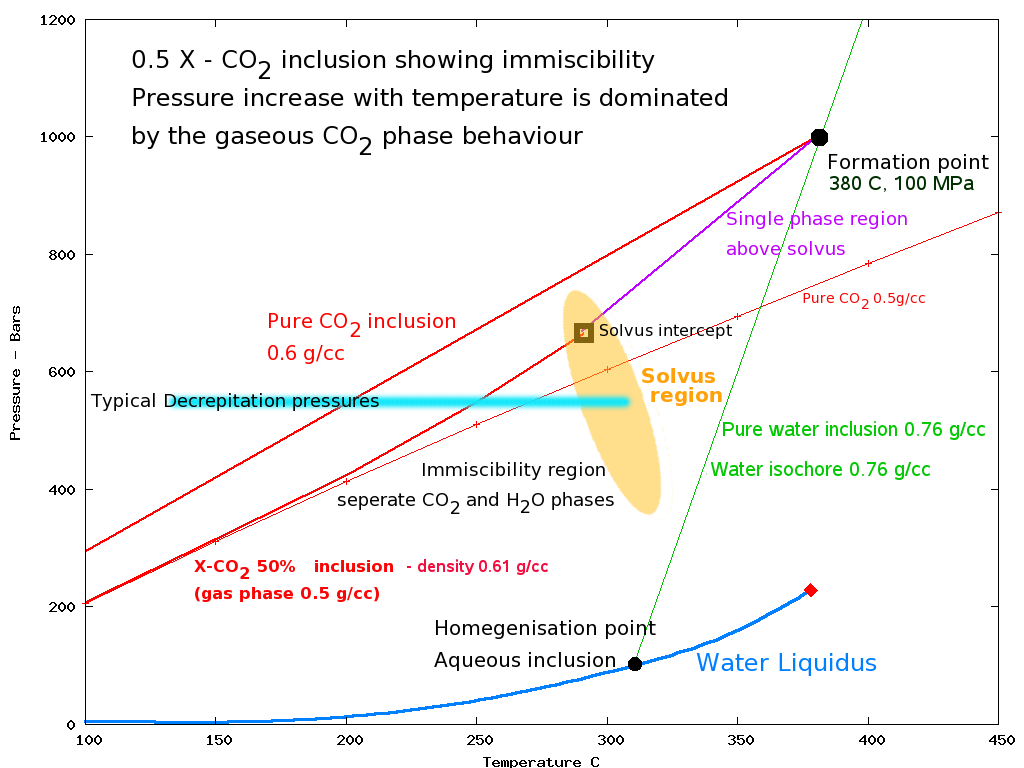
To understand why the baro-acoustic decrepitation method is
effective
in detecting gas-rich fluid inclusions we need only look at the
Pressure vs Temperature graph as fluid inclusions are heated.
On this graph I show the P-T relationships for fluid inclusions of
different compositions which all formed at the same hydrothermal PT
point of 380 C, 100 MPa. (1000 bars).
When heating the pure water inclusion, its PT graph is shown by the
blue and green lines. Initially the pressure does not increase much
as
the water expands to fill the bubble space. Only after the vapour
bubble has gone at the homogenisation temperature of 310 C does the
pressure increase substantially. When the pressure reaches some 600
bars at about 350 C the inclusion will decrepitate and this
temperature
can be used to estimate the formation temperature of the inclusion.
When heating gas-rich inclusions, the PT graph is shown by the red
lines. The pressure in such inclusions increases linearly with
temperature in accordance with the gas law, PV=nRT. Consequently the
inclusions reach internal pressures of some 600 bars at quite low
temperatures, as low as 200 C for a pure CO2 filled
inclusion. This results in distinctive low temperature decrepitation
and is the basis for the use of the baro-acoustic decrepitation
method
in identifying gas rich hydrothermal fluid systems. (Additional discussion here)
There are numerous accounts in the literature where observers
performing microthermometric analyses complain that the fluid
inclusions decrepitate before they homogenize and so they were
unable
to determine their homogenisation temperatures. The reason for this
is
obvious from the above graph, but this behaviour is considered a
nuisance in such work and the exploration significance of this
behaviour has been completely ignored. We need to stop focusing on
thermodynamic perfection to see the immense potential of this
behaviour
as an effective exploration technique.
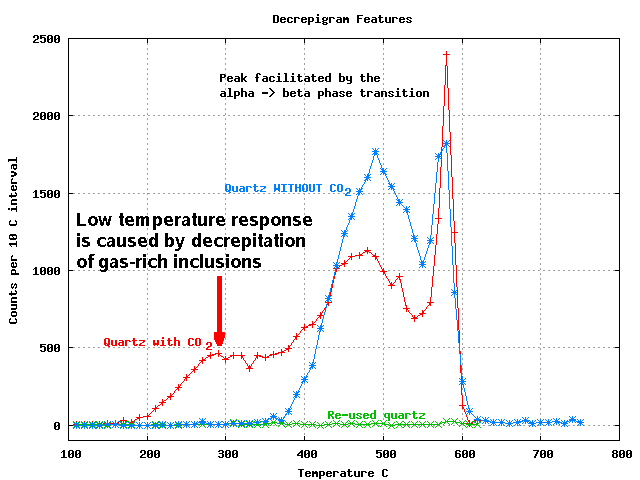
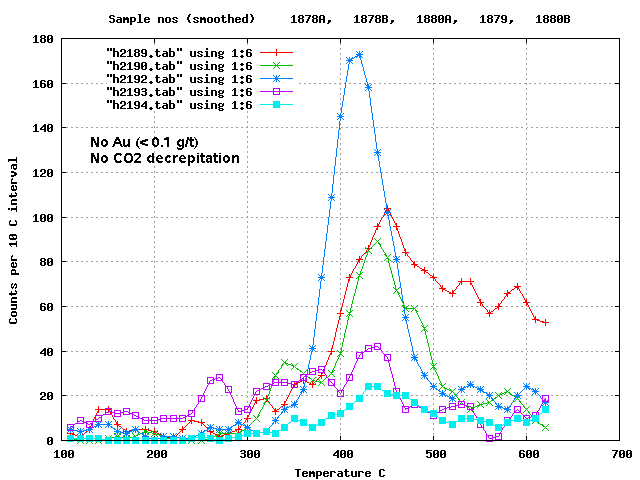
Some typical results from the decrepitation instrument show how easy
it is to identify gas-rich fluids.
The peak caused by the presence of gas-rich fluid inclusions is
clearly
seen near 300 C on the red graph, as expected from the
thermodynamics of gas-water mixtures. The blue graph is a sample
which
had only aqueous inclusions and this lacks decrepitation below 400
C.
Both of these graphs show a peak at 570 C, which is a caused by the
weakening of the quartz as it undergoes transition from the alpha to
beta structure. Fluid inclusions preferentially decrepitate at this
temperature while the quartz strength is compromised, which explains
the absence of decrepitation above this temperature. The green graph
shows the result on a sample that has already been heated
previously.
It has no response at 570 C, which confirms that the decrepitation
method does not detect mere crystallographic effects and only
detects
fluid inclusions. Details on the
quartz phase transition are here.
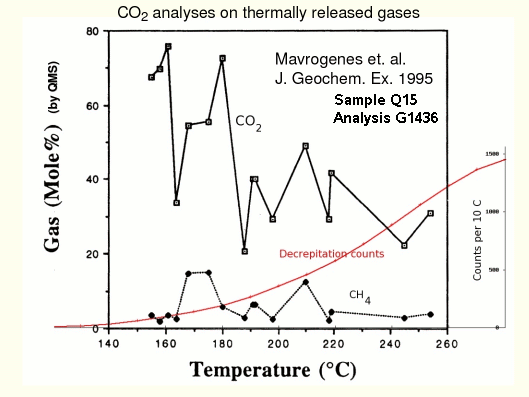
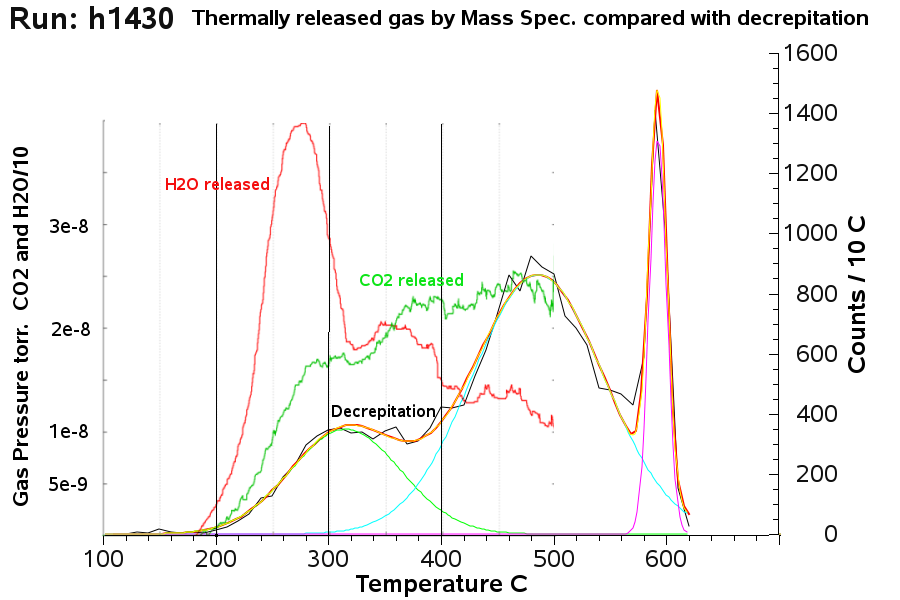
Some studies have been done where the thermally released gases
during
decrepitation have been analysed by mass spectrometer and these
confirm
that the low temperature decrepitation peaks are indeed related to
the
presence of gas-rich inclusions containing CO2 and CH4.
On this sample, from the Cowra creek goldfield, NSW, Australia, much
CO2
is released at very low temperatures, matching the low temperature
decrepitation counts observed on this sample. These fluid inclusions
are not only gas-rich, but also large, resulting in the substantial
amounts of CO2 detected by the mass spectrometer. An abstract of this work is here ,
and additional decrepitation data
is here.
An additional study of a sample from the Pine Creek goldfield in NT,
Australia carried out by D. Gaboury at U. Quebec also shows that the
low temperature decrepitation events correlate with the release of
copious amounts of CO2.
From the above discussion, we see that gas-rich inclusions give rise
to
prominent low temperature decrepitation peaks. Although CO2
is the most abundant gas in fluid inclusions, the low temperature
decrepitation is independent of the type of gas as the P-T
properties
of all gases are similar and described by the gas law. A discussion
showing the similarity of
decrepitation of various gases is here. In mineral exploration
both CO2 and CH4
are known to be strongly correlated with gold mineralisation and so
the
identification of low temperature decrepitation peaks can be used in
exploration for gold deposits.
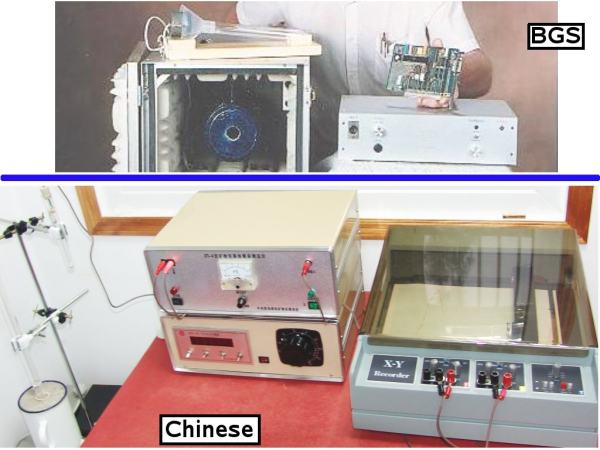
The decrepitation method is also used in China, where 2 instruments
are
known to be in current use. The Chinese instrument uses a completely
independent design and analog electronics, in contrast to the
computerised and fully digital BGS
model 105 instrument.
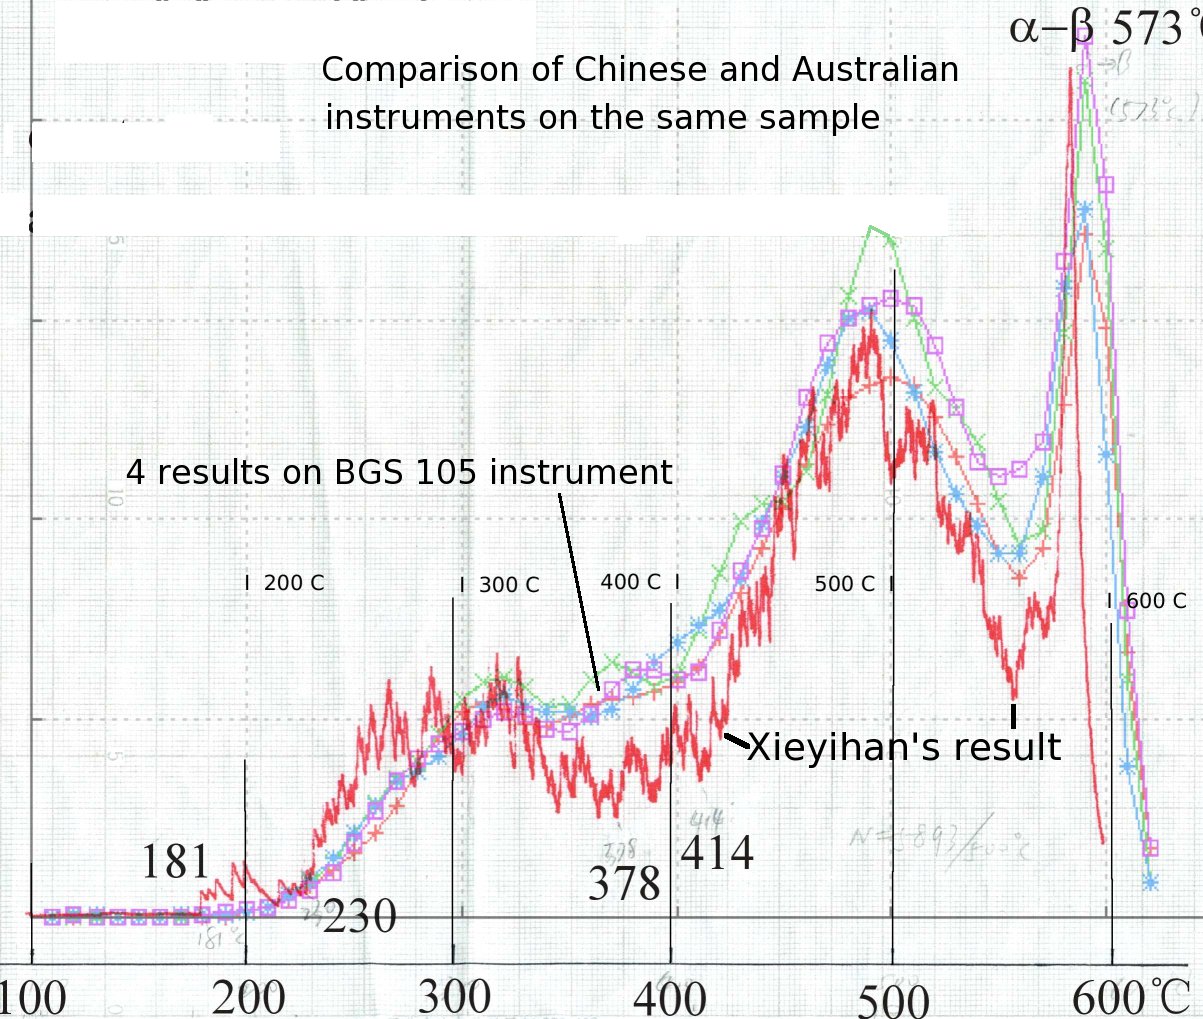
These are the 2 instrument designs known to be in current use.
The same sample has been analysed in these 2 different instruments
giving very similar results and confirming that the technique gives
reliable and completely objective results with different
instrumentation and operators.
This has shown the theory of the baro-acoustic decrepitation method.
The following data shows real world application of the method in
exploration for gold mineralisation.
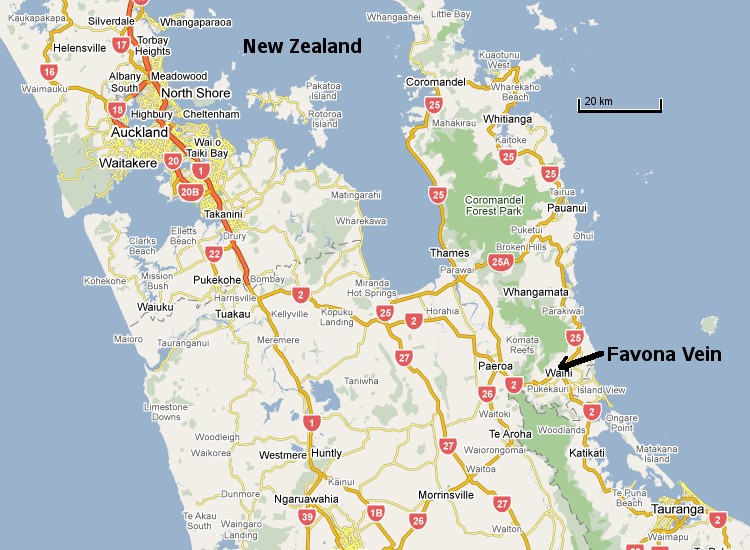
Favona mine, New Zealand
This mine is on the North Island of New Zealand.
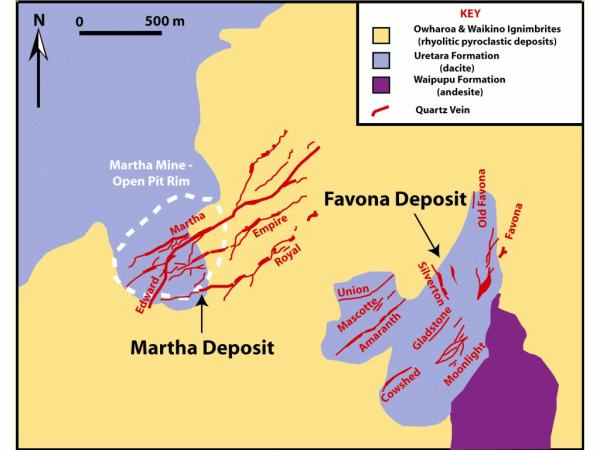
The gold occurs in quartz veins in a swarm.
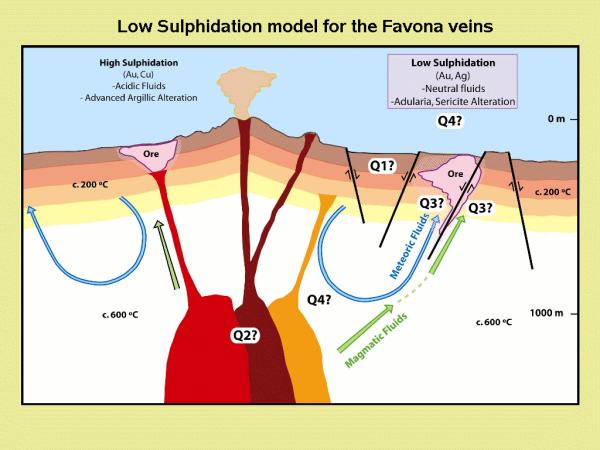
This is the deposit model for the epithermal quartz veins which are
of low sulphidation type.
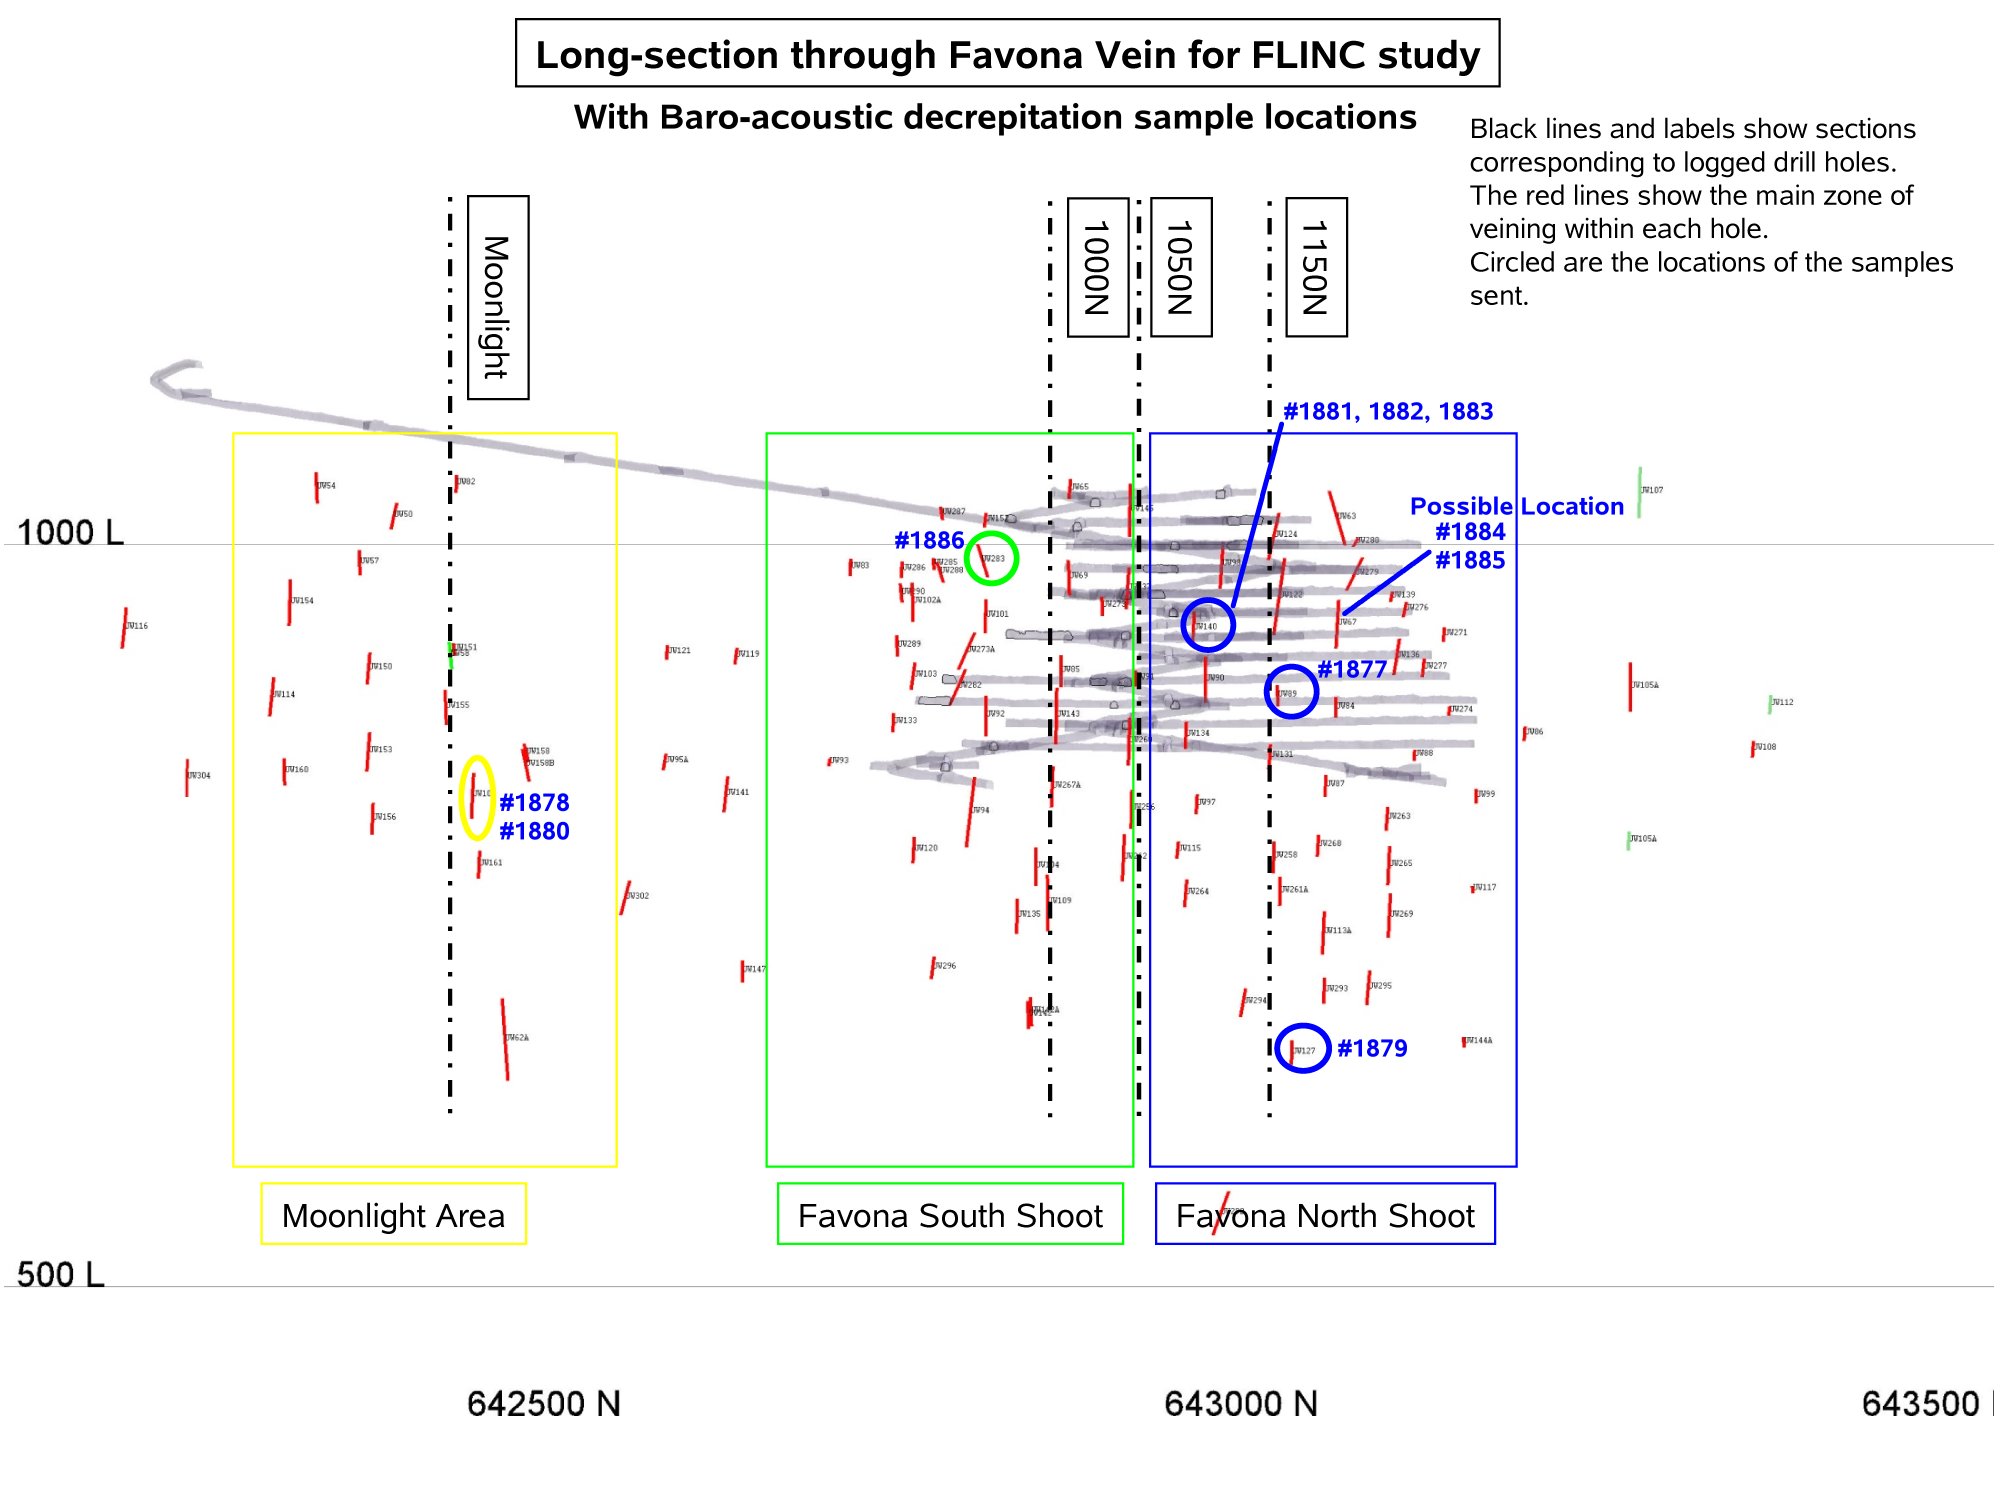
A suite of samples were provided by a research student from drill
core
within the mine. The locations and sample numbers are shown on this
pseudo section of the mine.
The thick gray lines show the mine workings and the entrance
decline.
The locations of samples 1884 and 1885 were incorrectly recorded by
the student and the probable location is plotted instead.
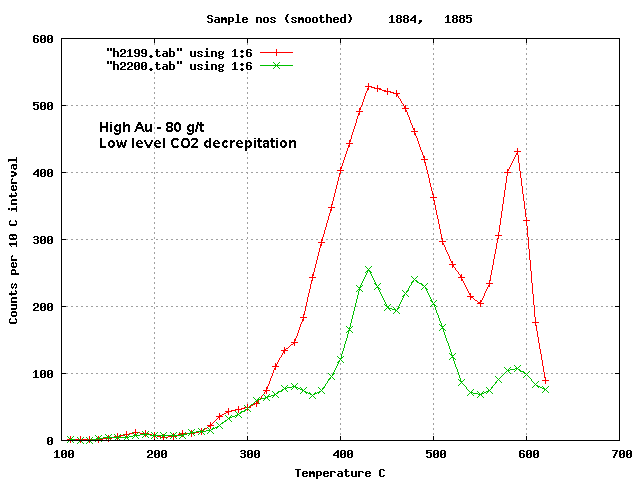
These 4 samples from the Moonlight and deep in the Favona vein show
very low decrepitation intensity, which is typical of epithermal
quartz
and also lack any low temperature decrepitation peaks, indicating
the
absence of gas-rich fluid inclusions. These samples have very low
gold
grades and are remote from known economic mineralisation. The
decrepitation data correctly indicates the low mineralisation
content
of these samples.
Samples 1884 and 1885 are within the mine workings and have very
high
gold contents. They have more intense decrepitation and a weak but
distinct low temperature decrepitation peak indicating the presence
of
gas-rich fluid inclusions in these mineralised areas.
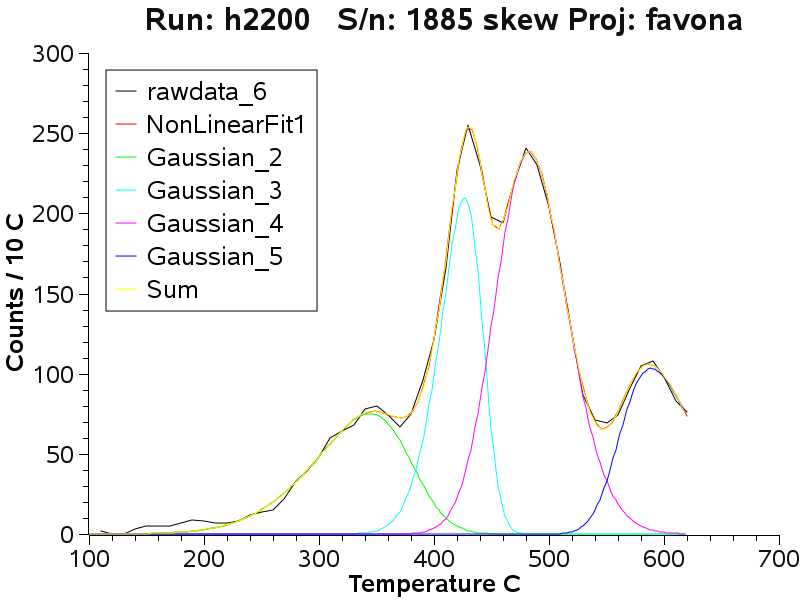
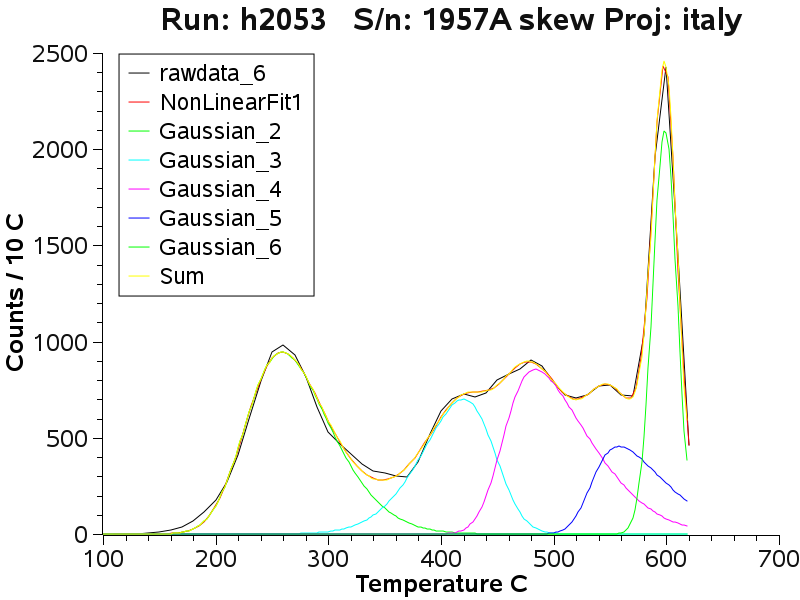
A rigorous evaluation of the decrepitation curves can be carried out
by
using de-convolution to fit skewed gaussian curves to the observed
data. The individual component gaussian populations can then be
precisely measured and their temperatures, widths, heights and
skewness
values determined. Sample 1885, one of the high gold content
samples,
plotted with the green curve in the above decrepigram, is shown here
as
an example of this curve fitting (de-convolution). Here the
raw
data is shown with the black curve, while the best fit data,
representing the sum of each of the 4 component populations, is
shown
by the red and yellow lines, which are superimposed. Note that there
is
very good agreement between the raw data and the fitted sum plots
and
we can be confident of the presence of 4 separate component
populations
of fluid inclusions in this sample. Note also that the population
component plotted in green is centered at the low decrepitation
temperature of 340 C, as is characteristic of decrepitation of
gas-rich
fluid inclusions.
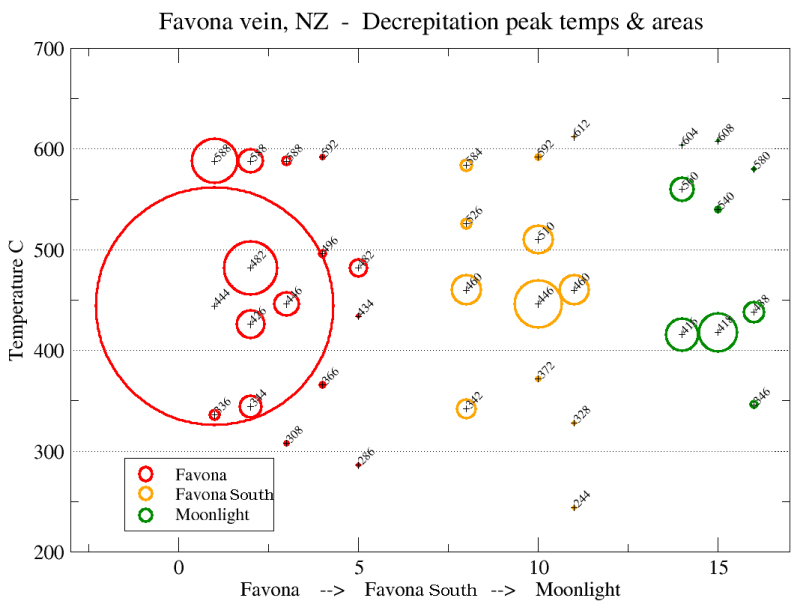
The curve fitting results for all of the samples are shown on this
bubble plot, where the circle diameter is proportional to the
decrepitation intensity of that component population.
The better mineralised Favona main shoot (red) has more intense
decrepitation and small but measurable low temperature,
gas-rich
inclusion decrepitation. The Favona South shoot (yellow) has
less
decrepitation and slightly less low temperature gas-rich
decrepitation.
And the Moonlight area (green) has much less low temperature
gas-rich
decrepitation. From this it is seen that the best exploration
areas are in fact in the shallow areas of the Favona South shoot,
which looks more promising
that even the deep samples from the Favona main shoot (sample 1879).
The data show that the Moonlight area is not a particularly
promising
exploration target.
Favona Summary
Epithermal deposits are difficult,
but
not impossible, to explore using baro-acoustic decrepitation.
Despite
the low decrepitation intensities, this data clearly shows a
strong
correlation between known gold grades and the presence of low
temperature gas-rich decrepitation. Because gold is distributed
inhomogeneously within veins, and gold analyses are complicated by
the
"nugget effect", using decrepitation is a much better way to
explore
these systems because fluid inclusions are far more abundant and
homogeneous within hydrothermal systems and provide a larger and
much more
reliable target to define the gold potential.
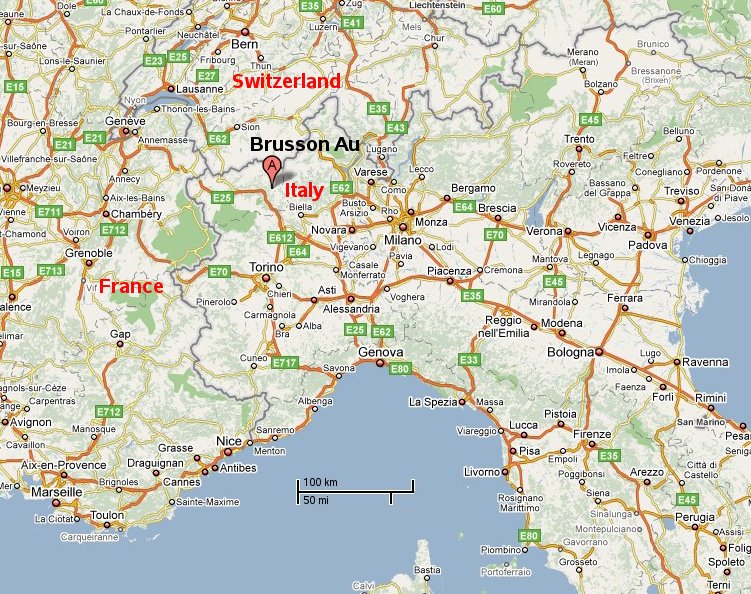
The Brusson gold mine, Italy
The Brusson gold mine in northern Italy has been known since roman
times and exploited up until the mid 20th century. It is
particularly
interesting because gold occurs within a well defined quartz vein,
but
the gold abruptly ceases where the vein passes through carbonate
host
rocks. There have been numerous studies using fluid inclusions and
stable isotopes to try and understand this cutoff of the gold
mineralisation. However, none of those studies has provided any more
than a vague hypothesis to explain this cutoff. The baro-acoustic
decrepitation data has provided critical information about the
quartz
which has led to concise explanation of the gold cutoff in this
deposit.
The mine is located in the Alps of northern Italy.
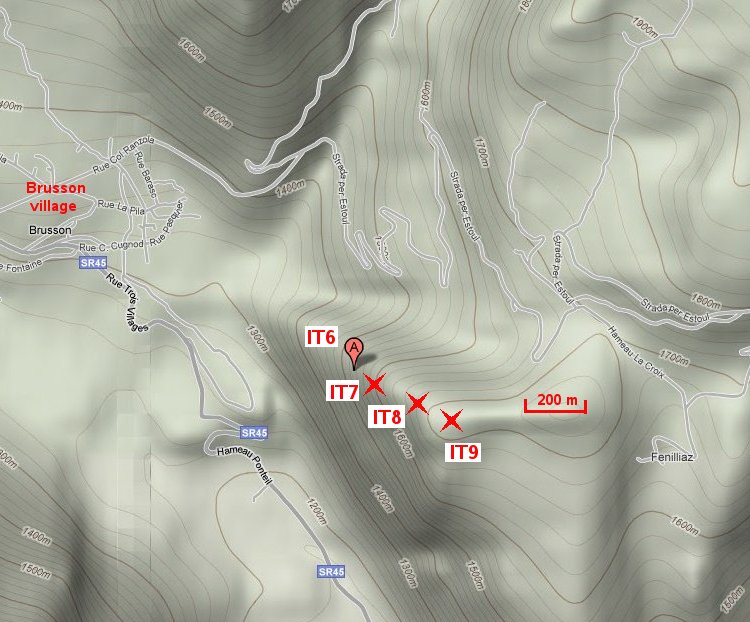
20 samples of quartz were collected at the adit entrances on each of
4
levels in the mine. It was not possible to enter the mine as the
workings are no longer safe.
The locations of the 4 adit entrances are plotted here, based on GPS
coordinates of the sample sites.
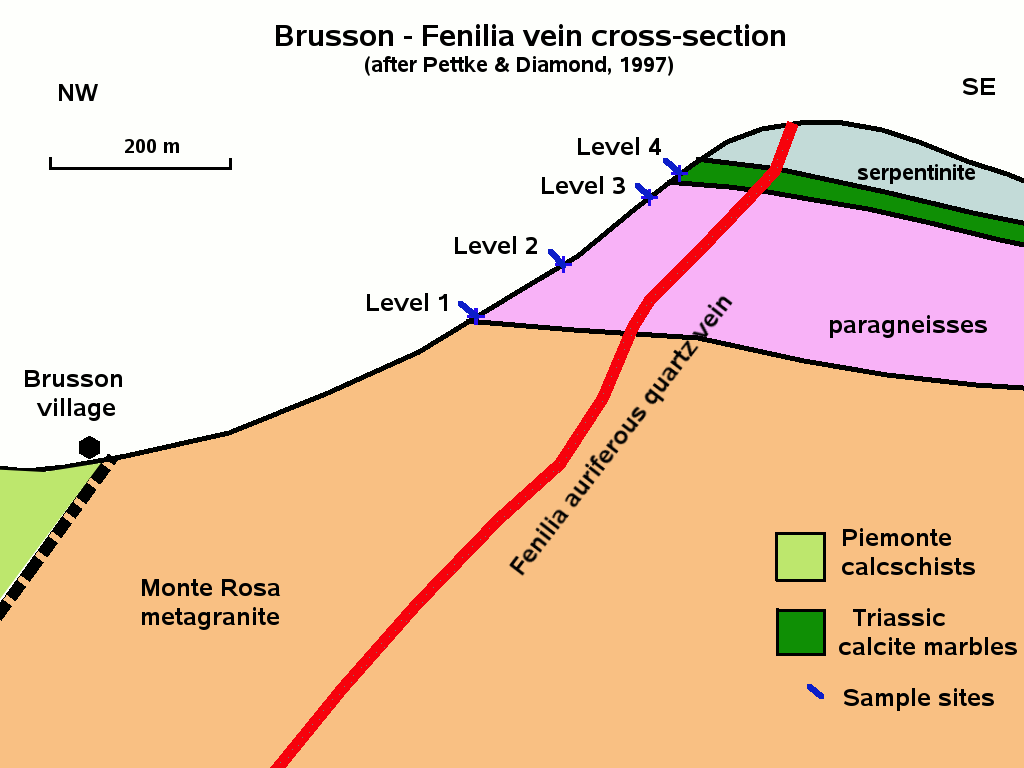
The geological cross section shows that the gold mineralisation
occurs
within the quartz where the vein is hosted by paragneisses at levels
1,
2 and 3. At level 4, the vein is hosted by carbonate rocks, and
there
is no gold in the vein at this level.
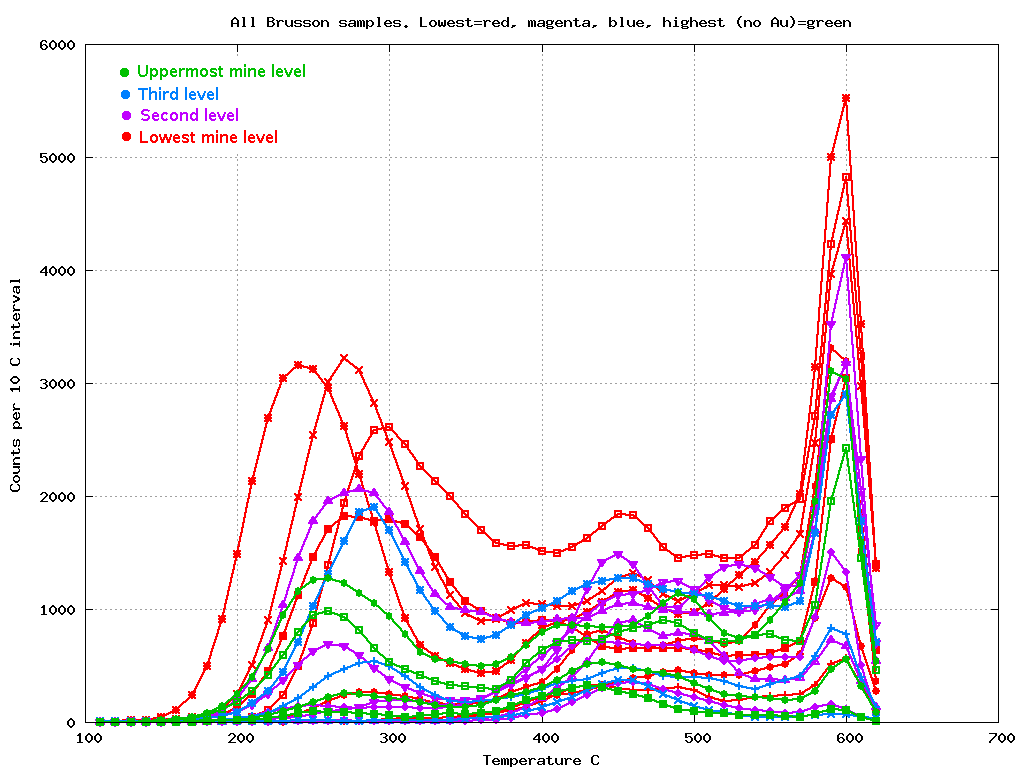
All 20 samples were analysed and when plotted together it is
difficult
to determine any pattern related to the mineralisation. But note
that
low temperature gas-rich decrepitation is intense and very common on
many of these samples, correlating with the good gold mineralisation
in
these samples.
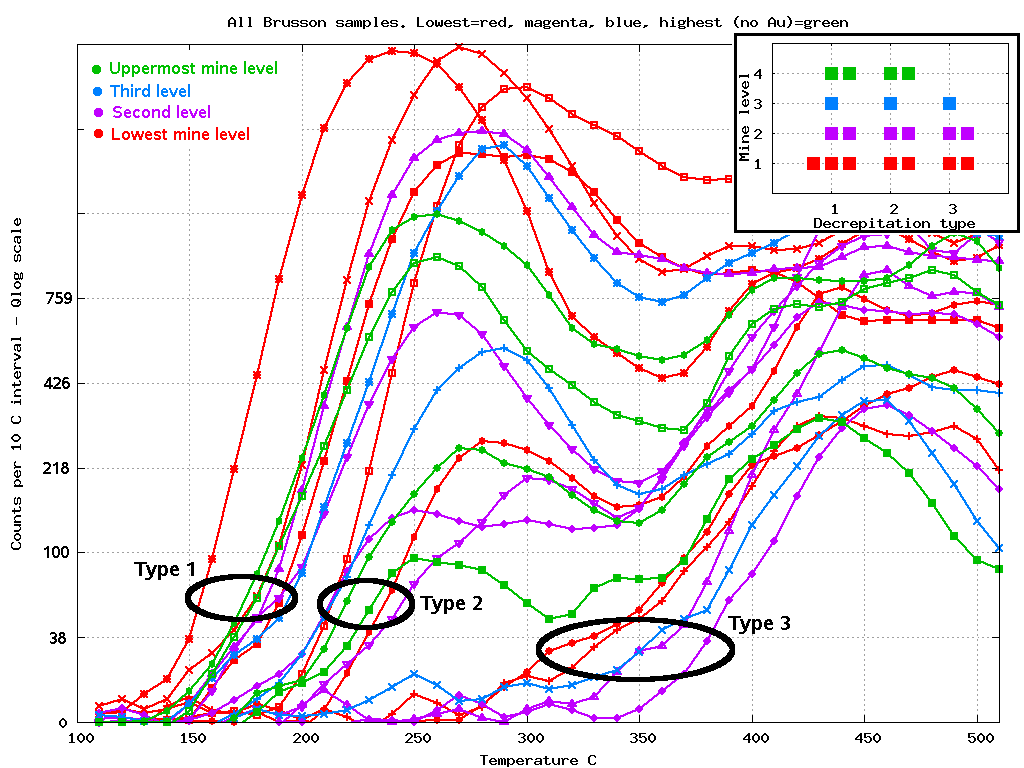
Using a logarithmic type scale, we can accentuate the low
decrepitation
intensity levels (around 100 counts), which are of most interest
when
interpreting decrepigrams. This re-scaled plot shows 3 separate
types
of clearly distinct fluid inclusion populations within the quartz,
which are called types 1, 2 and 3. In this plot, the samples are
also
colour coded based on the mine level they came from and it is
immediately obvious that there is no type 3 quartz present at the
uppermost mine level. Although it would be nice to have a few more
samples, statistical calculations show that the probability of this
distribution pattern occurring at random on 20 samples is only about
0.07 (7 %). We can be fairly confident that this pattern in the data
is
real.
This observation of significant differences in the fluid inclusion
populations of the quartz at the different mine levels provides a
critically important clue about the reason for the gold cutoff where
the vein is hosted by carbonate rocks. This information was not seen
in
any of the many previous fluid inclusion studies, carried out using
microthermometry, because those methods focus too closely on
individual
fluid inclusions and fail to understand the whole quartz system and
the
hydrothermal system from which it formed. Sometimes you must stand
further back to see the real information pattern within a picture!
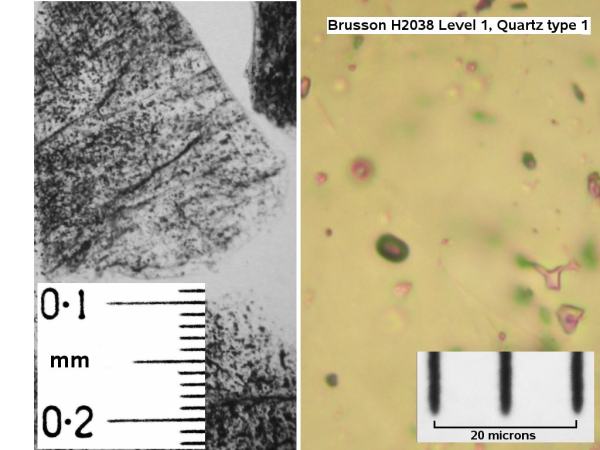
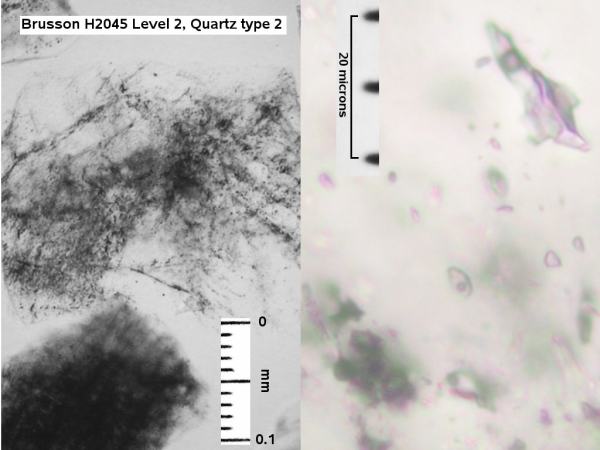
Microscope photographs of samples of each of the 3 quartz types are
shown below. Quartz types 1 and 2 seem to show the presence of some
larger inclusions, but without first having the decrepitation
information to classify the samples, it would be exceptionally
difficult to distinguish visually between the fluid inclusion
populations in these 3 samples. Usually, the differences seen here
would be ignored while the search continued for suitably large and
visible inclusions to study microthermometrically.
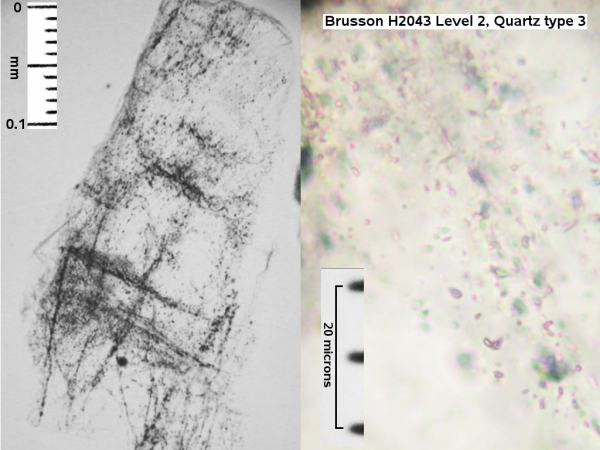
The inclusions in this type 3 quartz sample, H2043, seem to be
smaller.
But this subtle difference is usually ignored in microthermometric
studies.
This sample is from the uppermost mine level and is type 1 quartz.
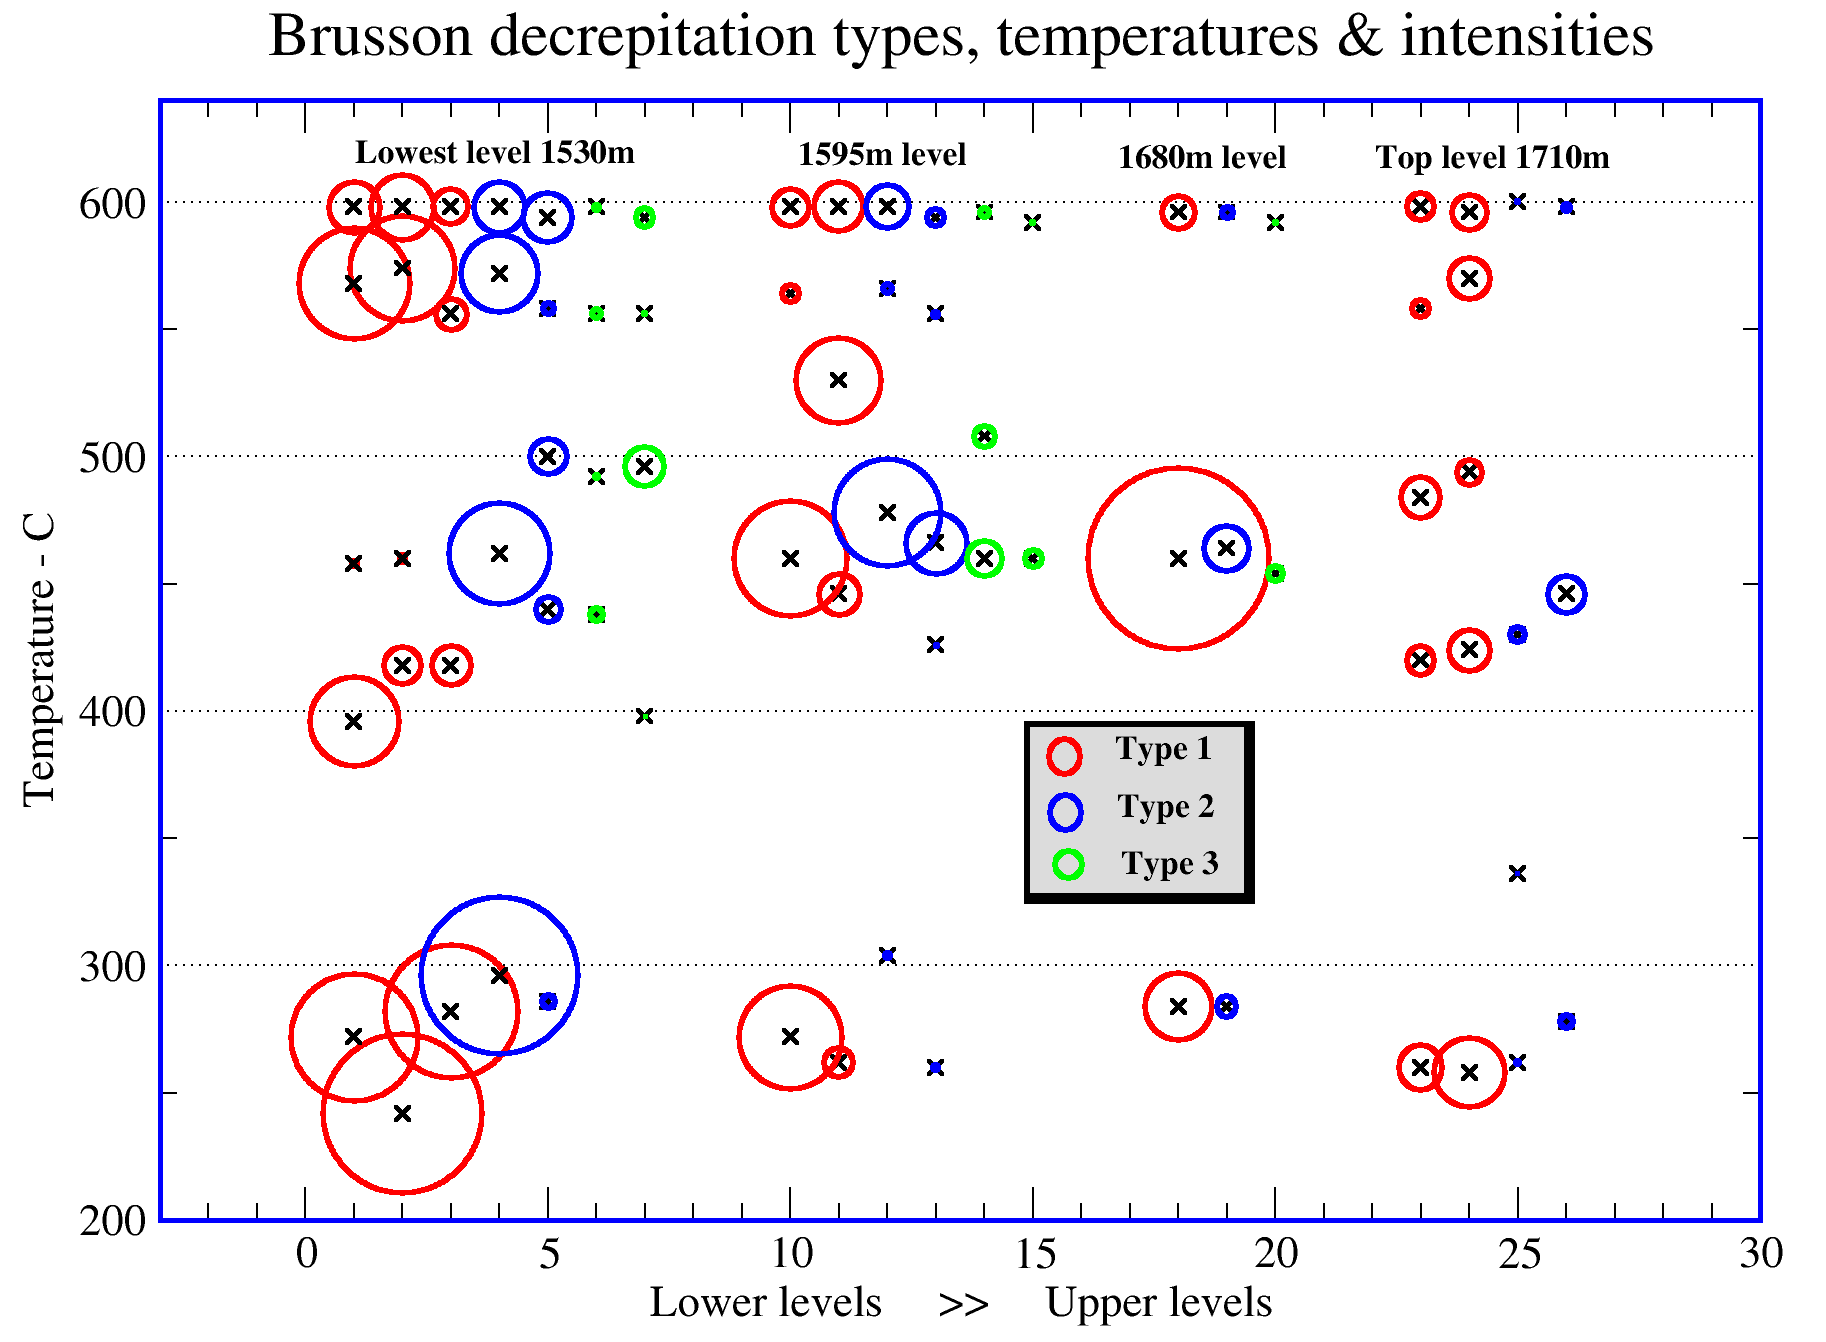
The data from the de-convolution of the decrepigrams of all the samples
in this study is shown here and is summarised in this plot,
where the diameter of the
circle is proportional to the decrepitation intensity (fluid
inclusion
abundance) of that component population. Note the absence of type 3
quartz (green) from the uppermost 1710m level. There also
seems
to be a decrease in both total decrepitation intensity and also low
temperature gas-rich decrepitation intensity as the depth within the
mine decreases.
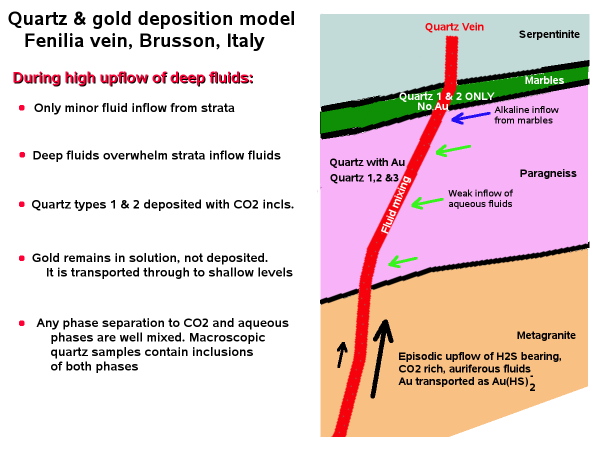
Brusson mine model - based on an understanding of the fluid
inclusion populations.
The Fenilia auriferous quartz vein at Brusson was formed from
auriferous fluids coming from the basement, in which the Au is
transported as a HS- complex, as shown by L.W. Diamond.
This was not, however, a
continuous steady flow and the flow was episodic.
During periods of high fluid
upflow
rates, the effect of the weak fluid inflow from the host
rock
units was minimal. The vein-flow fluid temperature remained high
and
there was little chemical change so the gold present remained in
solution and passed through the section without being deposited
while
type 1 and type 2 quartz was deposited.
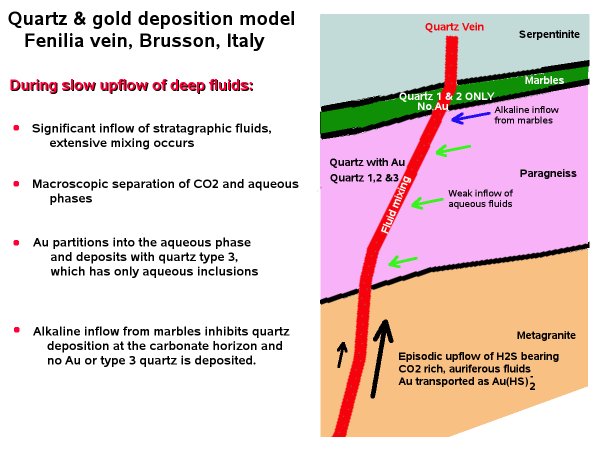
During periods of low fluid
upflow
rate, the inflow of fluids from the paragneiss host rock
unit
mixed with the basement sourced fluid and lowered the temperature
of
the vein-flow fluid. This resulted in phase separation of the CO2
rich fluid into an almost pure CO2 phase and an aqueous
dominated phase. H2S would partition preferentially
into the gaseous CO2 phase, depleting the H2S
and thus the HS-
concentration in the aqueous fluid containing the gold. This
caused the
deposition of gold because of destabilisation of the Au(HS-)2
complexes when the HS-
concentration in the aqueous phase decreased. This also resulted
in the deposition of type 3 quartz containing few or no CO2
rich fluid inclusions from this now aqueous, CO2
depleted fluid. At the upper mine level 4, the stratigraphic
inflow
fluid from the marble and serpentinite has a high pH, possibly
greater
than 10. Mixing of this fluid with that in the vein increases the
pH,
which
increases the solubility of the Au(HS)-2
complex and also increases the
solubility of silica, despite any temperature decrease which
terminates the deposition of quartz. Consequently the
quartz at this upper level lacks gold and also lacks type 3
quartz
deposition. It
is this change in pH caused by mixing with high pH
stratigraphic inflow
fluids that stops the deposition of gold in the vein at this
location.
And it is the recognition
of changes
in types of quartz, based upon the baro-acoustic
decrepitation data,
which makes it possible to explain this mineralisation
cutoff.
We know that gold deposits are
closely
associated with gas rich fluid inclusion, but this relationship
has not
been exploited as an exploration method because it is so difficult
to
get consistently reproducible and representative CO2
contents of inclusion fluids on a large spatial array of samples.
However, this information is available by using the baro-acoustic
decrepitation method, and there is a sound theoretical
understanding of
the decrepitation behaviour of gas-rich inclusions. Although
microthermometry can give more precise and intricate details about
sub-millimetre scale events in hydrothermal systems, the
baro-acoustic
decrepitation method is far more appropriate when dealing with
large
suites of samples and real-world macro-scale features of the
quartz
and hydrothermal systems of economic interest.
Microthermometry is great if you are trying to understand the the
minute details of a sample and reach thermodynamic nirvana.
But if you are interested in
exploring for economic mineralisation, baro-acoustic decrepitation
is the better method.
 Applied Mineral Exploration