Newest
Topics:
For the latest news, see the NEWEST TOPICS page.
Google is too dumb to let me put the list of news in this column and falsely claims that all my pages are self-duplicates.
Google-NONSENSE
Google's so-called "Artificial Intelligence" is an abuse of the concept of intelligence!
Using Baro-acoustic decrepitation data in
exploration at the Drake mineral field, NSW and the application of
curve fitting to the decrepitation data
Melissa Gibbes and Malcolm Clark, Southern Cross
University, Lismore NSW
Abstract
The Drake mineral field comprises fissure lodes, stockworks and
disseminations of epithermal to mesothermal Au-Ag mineralisation,
hosted within the
Permian Drake volcanics. There are base metal sulphides and
pyrite associated with the main mineralisation comprised of silver
sulphosalts and native metal alloys. To better understand this complex
hydrothermal system a suite of samples were analysed using
baro-acoustic decrepitation of fluid inclusions to understand the
hydrothermal fluid. The decrepigrams are complex and so deconvolution
fitting of multiple gaussian distributions was used to distinguish
individual fluid events. Initially, symmetrical gaussian distributions
were used, but we show that using skewed gaussian distributions is
preferable and provides better deconvolution and understanding of the
fluid systems.
Introduction
The
discovery of valuable mineral deposits is a long process, taking into
account many aspects including: the structure of the geology, the
grade of the ore, mineral processing procedures, the ongoing costs of
operation, environmental impacts, plus predictions of future metal
prices. Mining feasibility studies are long and costly and can be
limited by a lack of geochemical, geophysical, geological and remote
sensing exploration techniques available for a given location
(Bateman and Jensen 1981). The use of
decrepitation techniques to derive information from fluid inclusions in
the mineral samples can help to
assess suitable locations for mining exploration, improving the
economic viability of the venture and potentially minimizing
environmental disturbance (
Bateman and Jensen 1981, Craig and
Vaughan 1981, Pomârleanu & Mârza 2002)
The
study
of fluid inclusions can provide valuable data on the nature of the
ore fluid (Peach 1949, Roedder & Bodnar
1980, Edwards & Atkinson 1986, Burlinson 2006,
2007a, 2007b). Parameters that can be obtained include the
temperature of formation, salinity and chemical composition of the
mineral fluid. Upon reheating, the process that forms the fluid
inclusions is reversed; this is utilized in the decrepitation study
of inclusions (Edwards & Atkinson 1986).
Fluid
inclusions are small to microscopic quantities of liquid that are
trapped within a mineral as it crystallises (Peach 1949,
Roedder & Bodnar 1980).Although the inclusions are usually
homogeneous when trapped, once cooled to ambient temperature, they
tend to separate into a multiphase inclusion, most commonly vapor and
liquid (Roedder & Bodnar 1980). Sometimes during this process,
daughter minerals, commonly halite, are formed as the fluid contracts
and increases in concentration.
Gold
deposits are frequently associated with CO2
rich inclusions, which give a distinctive low temperature
decrepitation peak (Partamines & Poutiainen 2001, Mavrogenes
et al 1995, Burlinson 2006, 2007a,
2007b). This low decrepitation temperature is caused
by the commonly high internal pressures of CO2
rich fluid inclusions (Mavrogenes et al 1995).
Vapour rich inclusions also suggest that the fluid was at boiling
point at some stage during its accent to its current position
(Edwards & Atkinson 1986). Research has
shown that areas that are determined to be of epithermal origin are
highly likely to have gold and silver mineralisation at some depth
below the surface (Mavrogenes et al 1995).
Drake Geology
The
Late Permian Drake Volcanics has widespread epithermal Gold and
Silver mineralisation and has been mined intermittently for Gold,
Silver, Copper, Lead and Zinc since the 19th
century (Snowden 1987, Bottomer 1986, Clark
et al 2001).
The
Drake
Mineral Field is located within the area of a New England convergent
plate boundary leading in the north to calc-alkaline volcanism
(Bottomer 1986, Leitch 1975, Cawood 1982). This overlies the
Razorback Creek Mudstone which then overlies the Gilgurry Mudstone
(Beeson and Borton, 2005). The geology is described on the Drake
1:100,000 map by Thompson, J, 1976. The mineralisation of the Mineral
Field is
attributed to three styles:
Discordant
fissure veins,
Stratabound
stockworks and,
Stratabound disseminations.
Most
mineral assemblages in the area are made up of a combination of these
three styles (Beeson and Borton, 2005). The tectonic relationship of
the Drake Volcanics is not fully understood as detailed published
studies of this region have been insufficient (Bottomer 1986).
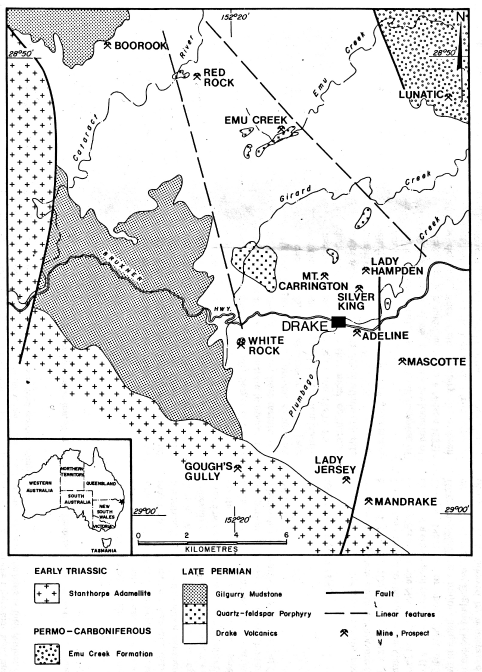
Figure 1. Location of Drake
within Australia displaying geological features. (Source:
Modified after Thompson
1976).
Mineralisation
and Alteration
The
mineralisation and alteration of the Drake Volcanics has been
multistage, most accounts suggest that the depositions occurred over
two episodes (Bottomer 1986, Perkins 1997, Smith 1989). The Mt
Carrington site has large areas that have undergone pervasive
alteration, including intense silica – sericite – pyrite
alteration in the central Strauss pit and North Kylo areas (Beeson
and Borton, 2005, Smith 1989).
This Study
The
study site is located within the Mt Carrington mine site, situated in
the Drake mining area in the Upper Clarence Catchment of Northern
NSW, Australia (Figure 1). The Drake mining area is located within
the New England Fold Belt (Lin et al 2003).
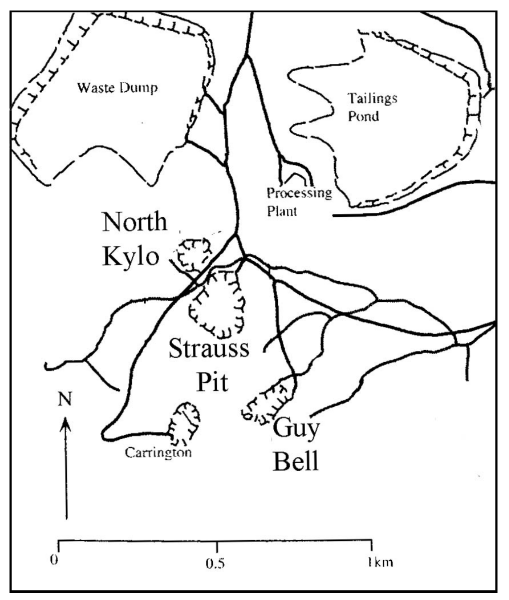
A
total of 33 samples were chipped out of insitu quartz veins at three
locations (Figure 2) on September 18th
2007. Four samples were collected from North Kylo (S28˚ 54. 449’,
E152˚ 22. 331’), 5 samples were from Strauss Pit (S28˚ 54. 579’,
E152˚ 22. 382’), and 2 samples from Guy Bell (S28˚ 54. 761’,
E152˚ 22. 441’). At each sampling point three replicates were
taken from veins occurring within a 1m2
area (Table 1).
Figure 2. Locations of sampling
sites: North Kylo, Strauss pit and Guy Bell sites:
(Source: adapted
from Clark et al)
Table 1. Sample matrix
showing sampling sites and replicate numbers.
Sample Site
Sample Location #
Replicate 1
Sample Number
Replicate 2
Sample Number
Replicate 3
Sample Number
North Kylo
1
1
2
3
North Kylo
2
4
5
6
North Kylo
3
7
8
9
North Kylo
4
10
11
12
Strauss Pit
5
13
14
15
Strauss Pit
6
16
17
18
Strauss Pit
7
19
20
21
Strauss Pit
8
22
23
24
Strauss Pit
9
25
26
27
Guy Bell
10
28
29
30
Guy Bell
11
31
32
33
The samples were weighed and photographed after collection. The weight
of the samples varied from 13.7g to
775.9g. A visual assessment determined variation in the width of the
quartz veins to be around 1 to 10cm across. The chemical composition
of the samples also showed variation, from semi-translucent to milky
grey and white, sometimes greenish quartz, jasper was very prominent
is a few of the samples. Other minerals present include galena,
haematite, and some of the samples showed signs of oxidation. The
samples were analysed by Burlinson Geochemical Services in the
Northern Territory on the BGS model 105
decrepitometer, as per methods used in Burlinson 1988 and
described on this website.
De-convolution
modeling
The data was curve fitted and de-convoluted using Plot® 0.997
software. Estimates of the position, width and height of Gaussian
peaks were made and entered, the software then iteratively fits these
Gaussian curves. Fitting is assumed complete when further iterations
provide no further improvement of the quality of fit by minimising
the RSD of the fitted envelope curve to the experimental data. An RSD
of <5% was used as a benchmark for a good fit. Chi-squared is also
kept to a minimum, but the overall effectiveness of chi-squared is
more limited as it depends on the degrees of freedom in the sample:
the more Gaussian curves to fit, the higher the degrees of freedom.
The assumption used is that the distributions applicable would be
symmetrical about the point. However, this assumption is shown to be
invalid and skewed-Gaussian distributions should be applied.
After
de-convolution was completed, the plots and data were
analysed for trends, similarities and differences between sample site
curve fits. The temperature of each Gaussian sub-population was
recorded and plotted as a frequency distribution at 50˚C intervals:
this was done for all samples combined, and for individual sites in
the study area.
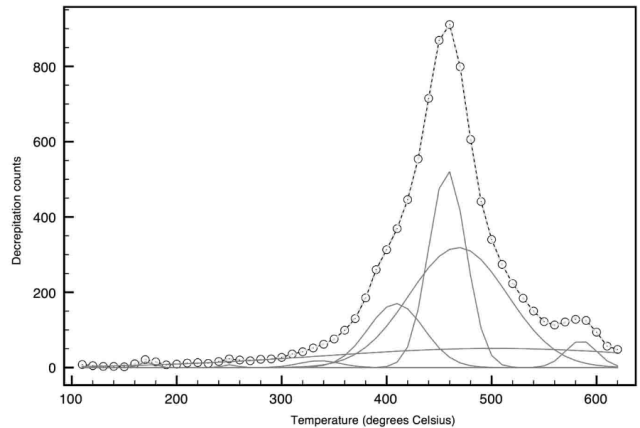
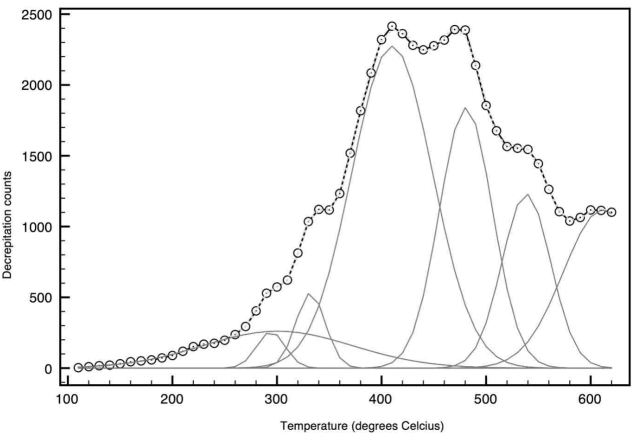
The results show
multiple Gaussian distributions of temperature populations, which
occur under curves that range from quite narrow (Figure 3) to very
broad (Figure 4)
Figure 3. Sample 28 exhibits narrow distribution.
Figure 4. Sample 18, exhibits broad distribution.
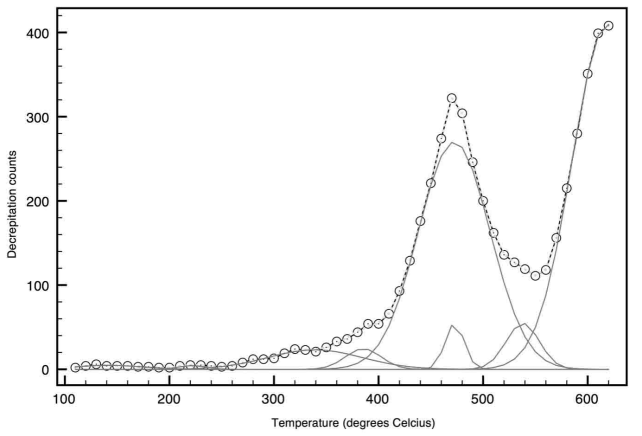
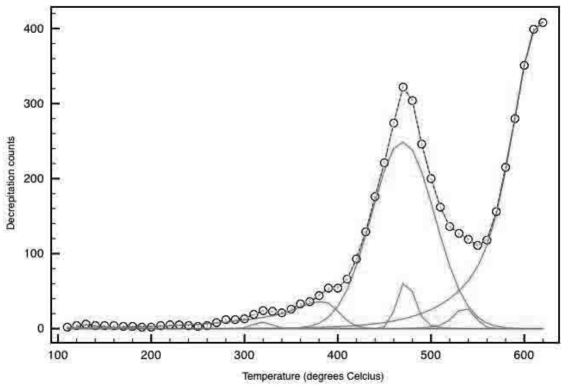
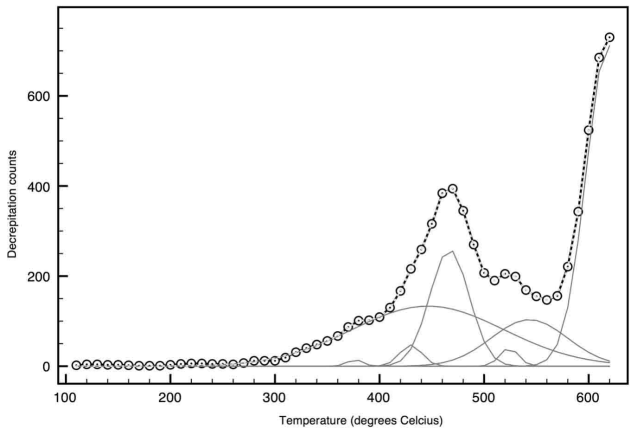
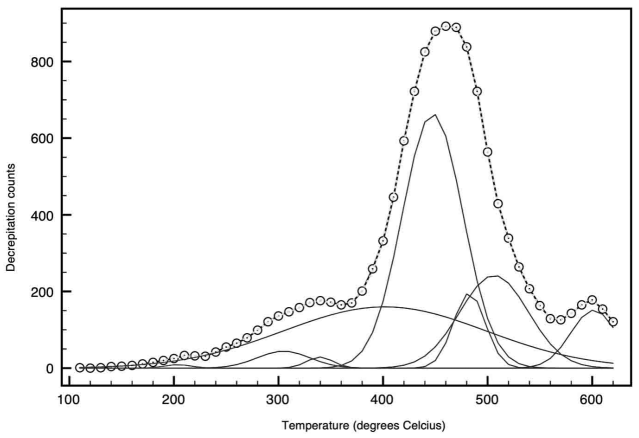
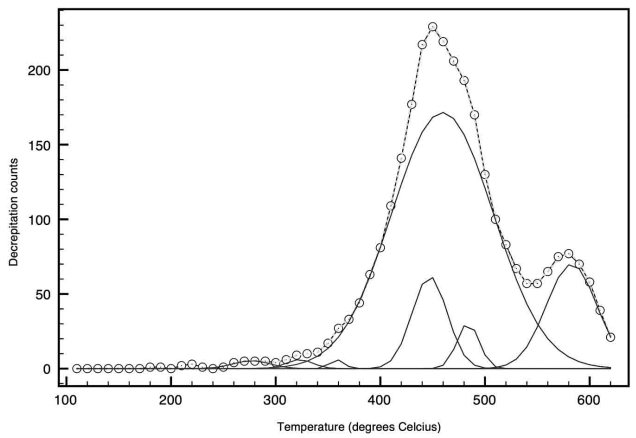
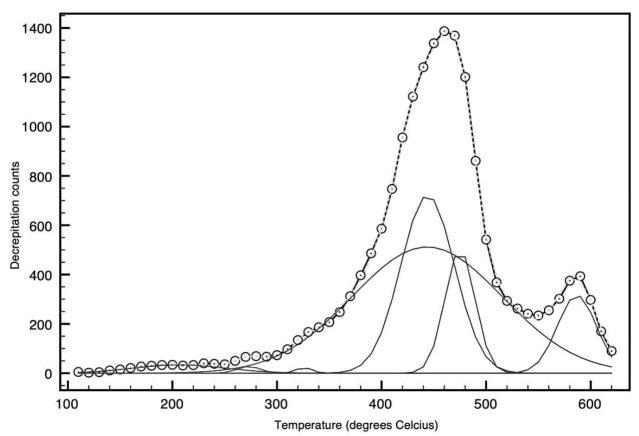
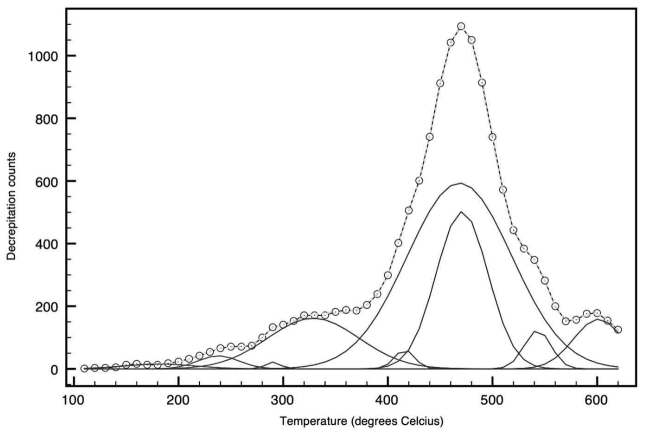
De-convolution
Samples
10, 11 & 12 were fitted using both symmetrical and asymmetrical
distributions (Figures 5- 10). These samples
show what is present in most of the other samples, a platy-kurtic
population curve leading into a lepto-kurtic population at a slightly
higher temperature. This is prominent at just below 400˚C in sample
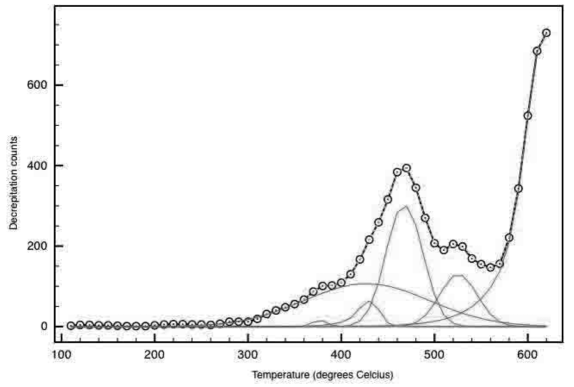
10 (Figure 5), when refitted allowing for a skewed distribution
(Figure 6) the two Gaussian sub-populations become one skewed
Gaussian sub-population. This trend is also easy to see in sample 11
(Figure 7) at 300˚C, and again just above 500˚C in sample 12
(Figure 9). This refitting simplified the curve fit, resulting in
fewer population distributions within each sample.
Figure 5. Sample 10, symmetrical distribution.
Figure 6. Sample 10, asymmetrical distribution.
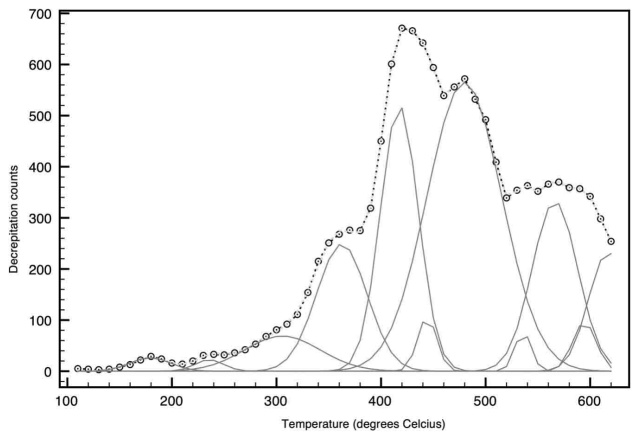
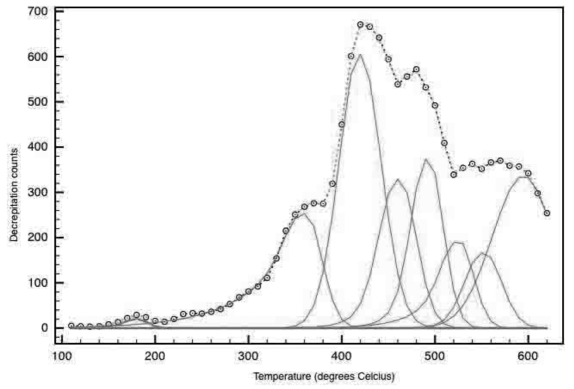
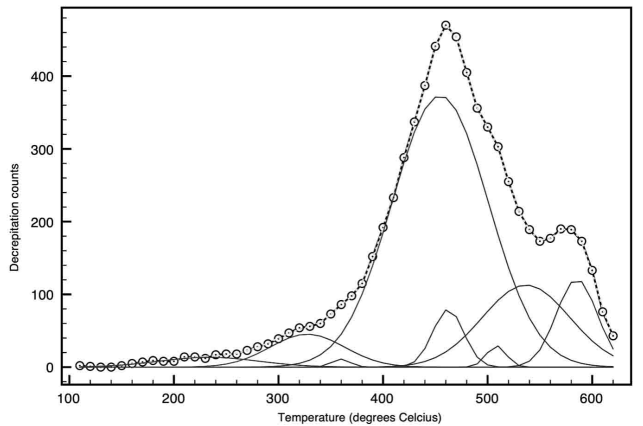
Figure 7. Sample 11, symmetrical distribution.
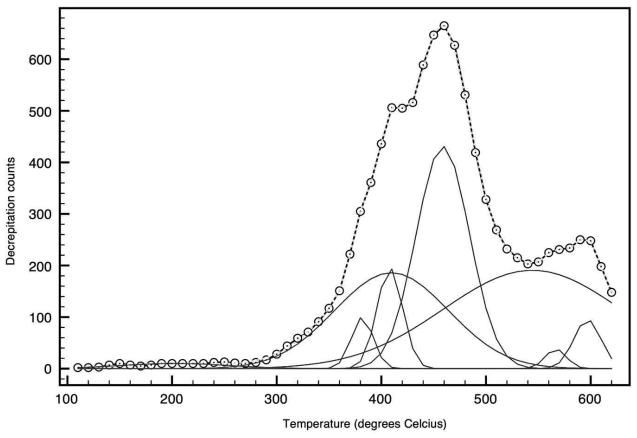
Figure 8. Sample 11, asymmetrical distribution.
Figure 9. Sample 12, symmetrical distribution.
Figure 10. Sample 12, asymmetrical distribution.
Jasper
Rich Veins
Six samples were visually rich in jasper (Appendix 1.2) all
displaying high temperature distributions with the low temperature
ranges mostly absent (Figures 11-16). The curve shape of each of
these samples is very similar, featuring one high intensity
temperature peak at around 450˚C.
Figure 11. Sample 13, rich in Jasper.
Figure 12. Sample 15, rich in Jasper.
Figure 13. Sample 22, rich in Jasper.
Figure 14. Sample 14, rich in Jasper.
Figure 15. Sample 19, rich in Jasper.
Figure 16. Sample 23, rich in Jasper.
Discussion
Data Complexity.
Multiple
distributions due to temperature variation within a single event.
From the initial analysis of the raw data it appeared that each
sample consisted of multiple distributions of data. Then each data
set underwent curve fitting, using symmetrical Gaussian
distributions. This revealed that in fact there were multiple
distributions occurring within each sample, and that the data was
quite complex.
Although the emplacement for a particular peak may have
occurred in
one event, there is temperature variation between the pulses of fluid
over the duration of the emplacement.
As the vein opens, fluid coming up from below is hotter than the
surrounding rock, which chills the fluid. An equilibration occurs
between the fluid and the surrounding rock, resulting in what may be
detected as a separate distribution beneath a larger curve.
Symmetrical or
Asymmetrical “skewed” distribution?
Upon
initial analysis of the raw data it was clear that the Decrepigram
was displaying multiple populations within each sample, as such,
multiple symmetrical Gaussian curves were chosen as the most
appropriate method of statistical analysis. The resulting data plots
from this method were interpreted over a period of time, but it soon
became apparent that there was something
not quite right about the shape and fit of the curves. Possibly due
to the complexity of the software, and limited processing time, it
took some time before the realisation that the distribution of the
data would be better represented by a skewed curve.
This realisation was brought about by the common occurrence of a
sequence of curve shapes. A platy-kurtic population curve leading
into a lepto-kurtic population at a slightly higher temperature was
determined to be a good candidate for a single distribution, which is
skewed toward a ceiling before dropping away.
Samples 10, 11 and 12 were refitted using skewed distributions
(Figures 5-10), the curve shape indicated a slow increase in
decrepitation followed by a faster increase to a maximum, where the
decrepitation counts fell suddenly. The re-fitted curve provided very
similar fit parameters in terms of error distribution, but a much
simpler fit with fewer distributions underneath the curve.
Variation due to
wall thickness of inclusions.
Due
to the variation in wall thickness of the samples an asymmetric
distribution makes more sense. Temperature of decrepitation is likely
to be affected by the position of the inclusion within the mineral.
Inclusions that are surrounded by a thin outer wall mineral are
likely to decrepitate earlier, even if the temperature has not yet
reached the temperature of emplacement, as the thinner the mineral
wall the weaker it invariably is. Inclusions that are embedded deeper
within the mineral are likely to decrepitate closer to the actual
temperature of mineralisation.
Another factor influencing the early decrepitation of fluid
inclusions is the shape of the inclusion itself. Angular inclusions
are known to stress at the corners which causes premature
decrepitation. Due to the size of most inclusions, tedious
preparation and microscope work would be required to determine if
this was the case, this would require the traditional methods of ore
microscopy be used.
A variation in the wall thickness of the inclusion would explain the
tendency toward an asymmetrical skewed distribution. The frequency of
the decrepitation pops creeps up as the inclusions with thin walls
decrepitate, then the frequency of the decrepitation ceilings as the
true temperature is reached, then drops off sharply at the end of the
event.
Variation due to
multiple deposition events.
The
results indicate multiple mineralisation events, both in the physical
appearance and in the multiplicity of distributions within the data.
This is consistent with the theories of previous research (Bottomer
1986, Perkins 1997, Smith 1989). The composition
of the fluid is not necessarily changing but the multiple
distributions may be represented by different opening regimes.
Further studies could clarify this issue.
Jasper rich Veins
The veins which were embedded within rocks with high levels of jasper
generally show high temperature peaks only, low temperature peaks are
mostly absent. This indicates first phase mineralisation, as jasper
is iron contaminated quartz, formed from high temperature oxidising
fluids. The types of veins exhibited here are skewed toward the
mesothermal system, due to their high temperature range. These
samples are not representative of the full range of temperatures
present within the area, but do provide a good representation of the
high temperature range.
Variation in distribution
The results show that there is a high level of variation in the
distribution of temperature ranges (Figures 3 &4). The jasper
rich veins exhibit temperature ranges that are spread over the high
end of the temperature range, with one main peak, whereas other
samples have temperature distributions spread over the high and low
temperature ranges, some displaying sharp individual peaks, and
others displaying very wide distributions that are not as well
defined.
Variations in
decrepitation intensity.
There
is a noticeable variation of the intensity (frequency) of the
decrepitation peaks. Although this study does not focus on
decrepitation intensity, this is a point worthy of noting. This
variation can be attributed to variations
in the number of inclusions present in the sample and their size
distribution, and/or the influence of the alpha-beta phase
transition.
Conclusions
Mineralized quartz samples from the Drake area give complex
decrepigrams with moderate intensities which indicates that the
mineralisation formed at upper mesothermal to deep epithermal
conditions from fluids of very variable composition during the
mineralising event. Although some previous fluid inclusion studies
using microthermometry were unable to obtain satisfactory data due to
the small size of the fluid inclusions, baro-acoustic decrepitation is
able to produce consistent and meaningful results on these samples. We
used de-convolution to resolve the complex decrepigrams into
individual, overlapping gaussian distributions of inclusions which are
thought to represent major fluid composition events. There were as many
as 11 gaussian distributions identified in the deconvolution of some of
the decrepigrams (sample 11, symmetrical distributions), which may
indicate the presence of highly varying
fluid conditions and complex zonation of the mineralisation. The
deconvolution was improved by using skewed gaussian components rather
than symmetrical gaussian components. Using skewed distributions, the
fit for sample 11 reduced to 8 components instead of 11. We suggest
that the skew is
related to the physical environment of the inclusions within the host
mineral, with inclusions near grain surfaces or fractures being able to
decrepitate at lower pressures than is normal for other inclusions from
the same fluid event.
References
Beeson B, Borton D. 2005. The Mt Carrington
epithermal
Gold-Silver-Zinc system and the host Drake volcanics. Drake
Resources. Company report. Bottomer L. R. 1986. Epithermal silver-gold
mineralization in the Drake area, Northeastern New South Wales.
Australian Journal of Earth Sciences.
Vol. 33, Issue 4, 457 – 473. Bateman A. M. and Jensen M. L. 1981. Economic
Mineral
deposits. Revised Printing. John Wiley & Sons, Inc. Burlinson K. 2007a. Acoustic Decrepitation as a means of
rapidly determining CO2
(and other gas) contents in fluid inclusions and its use in
exploration, with examples from gold mine in the Shandong and Hebei
provinces in China. Acta Petrologica
Sinica.Vol. 01. Burlinson K. 2007b. An updated
understanding of Acoustic
emission decrepitation. European Current
Research on Fluid Inclusion (ECROFI-XIX).
University of Bern Switzerland, 17-20 July, 2007. Abstract volume, p.
1. Burlinson K. 2006. Hydrothermal fluid
chemistry in
exploration. Acoustic Decrepitation as a method of locating
potentially auriferous quartz systems formed from CO2
rich fluids. Australian Earth Sciences
Convention, Melbourne Burlinson K. 1988. An instrument for
fluid
decrepitometry and examples of its application. Bulletin
de Minĕralogie. 111: 267-278. Cawood P. A. 1982. Tectonic reconstruction
of the New
England Fold Belt in the Early Permian: An example of development at
an oblique-slip margin. New England Geology,
University of New England, Armidale. Clark M. W., Walsh S. R, Smith J. V. 2001.
The
Distribution of heavy metals in an abandoned mining area; a case
study of Strauss Pit, the Drake mining area, Australia: implications
for the environmental management of mine sites. Environmental
Geology. 40 (6) March 2001. Springer-Verlag. Craig J R, Vaughan D J, 1981. Ore
Microscopy and Ore
Petrography. Wiley Interscience Publication Edwards R P and Atkinson K. 1986. Ore Deposit
Geology.
Chapman and Hall Ltd. Leitch E. C. 1975. Plate tectonic
interpretation of the
Palaeozoic history of the New England Fold Belt. Geological
Society Am.Bull. 86, 141-144. Lacerda L. D. 1997. Global emissions from
gold and
silver mining. (Abstract only). Water, Air,
&
Soil Pollution. Springer Netherlands. 97.
3-4/July. Lin C, Maddox G, Bateman E, Clark M, McConchie
D. 2003.
Acidity and Major Cations in Surface Soils of a Sulfidic Mine Site,
Australia: Implications for Mine Site Rehabilitation. Environmental
Sciences, 10, 3 (2003) 165 – 173.
Mavrogenes J. A, Bodnar R. J, Graney J. R, McQueen K.
G,
Burlinson K. 1995. Comparison of Decrepitation, microthermometric
and
compositional characteristics of fluid inclusions in barren and
auriferous mesothermal quartz veins of the Cowra Creek Gold District,
New South Wales. Journal of Geochemical
Exploration. 54. 167-175 Partamines
S. A. G, Poutiainen M. A. J. 2001. Application of acoustic fluid
inclusion decrepitometry to gold exploration in Finland.
Geochemistry:
Exploration, Environment, Analysis.
1. 109-117. Peach P. A. 1949. A Decrepitation
Geothermometer.
American Mineralogist.
Vol 34. May-June. 413-421. Perkins C. 1997. Geological and chemical
comparison of
two epithermal precious metal systems: the Late Permian Red Rock
deposit, Drake Volcanics, New South Wales, Australia, and the Miocene
Gooseberry Deposit, Kate Peak Volcanics, Nevada,USA. Unpublished PHD
thesis. University of New England, Armidale. Pomârleanu V, Mârza I. 2002. Implications
resulting from the study of fluid inclusions in the shear zone-type
gold mineralization from Bozovici (Banat) and Someşul Rece (Gilâ
U Mountains). Studia Universitatais
Babeş-Bolyai, Geologia, XLVII, 1, 2002,
105-116. Roedder E, Bodnar R. J. 1980. Geological
pressure
determinations from fluid inclusion studies. Annual
Review. Earth Planet. Science 1980. 8 : 263
–
301. Smith S. G. 1989. Geology and geochemistry
of Permian
epithermal deposits at Drake: a study of a precious metal-base metal
hydrothermal system. BSc Hons thesis.
University of New England, Armidale (unpublished). Snowden H. H. 1987. Drake: Stories of
Life and Times in
an Old Mining Town.
Thompson J. 1976. Geology of the Drake 1:100 000
sheet.
Geol. Surv. N.S.W.
Sydney
 Applied Mineral Exploration