Newest
Topics:
For the latest news, see the NEWEST TOPICS page.
Google is too dumb to let me put the list of news in this column and falsely claims that all my pages are self-duplicates.
Google-NONSENSE
Google's so-called "Artificial Intelligence" is an abuse of the concept of intelligence!
Brief decrepitation summary of
samples from the 20 IGES field trip F1
El Penon mine, Chile
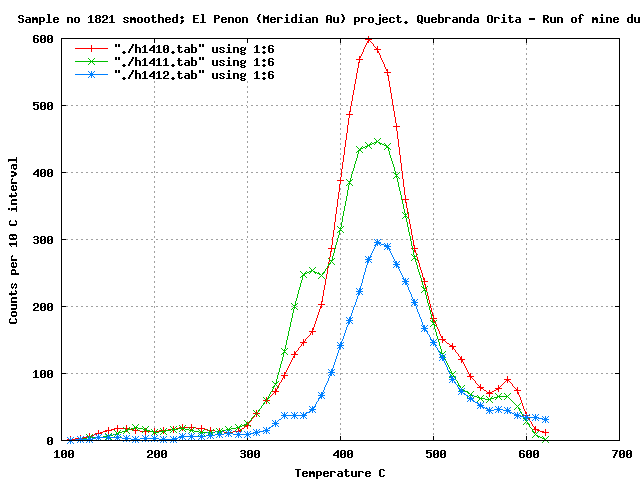
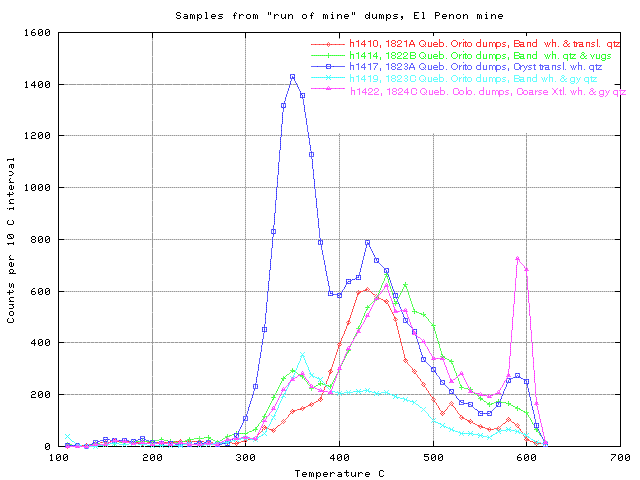
A suite of samples was collected
from the run-of-mine dumps at the El penon mine, as underground access
was unavailable. 3 sets of samples were collected from the Quebrada
Orito dumps, and one sample set from the Quebrada Colorada dumps.
These samples all had significant decrepitation intensities, which
implies that the fluid inclusions are dominantly liquid and that they
formed at relatively high pressure at considerable depth. This is
unusual for an epithermal deposit formed in a surface environment and
El Penon would seem to be of very deep epithermal or perhaps
mesothermal origin. Many samples also have a distinct early
decrepitation peak near 350 C which is indicative of the presence of
high internal pressure CO2 rich inclusions, which also
points to a deep origin for this deposit.
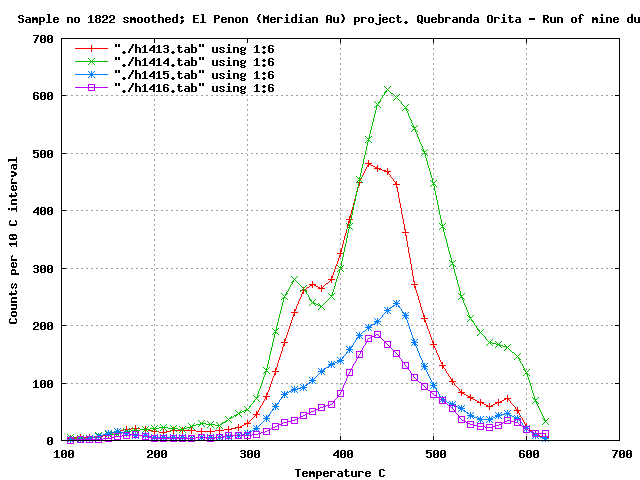
There was no consistently recognizable difference between results from
the 2 different vein systems and both these veins seem to have formed
under similar or identical fluid conditions.
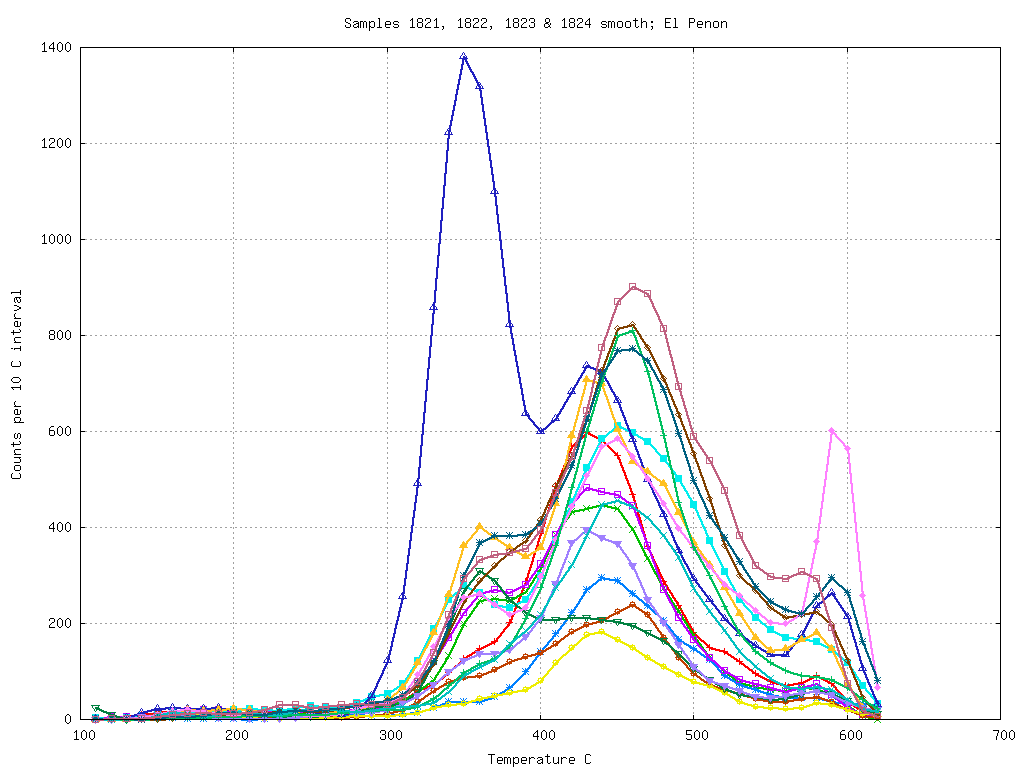
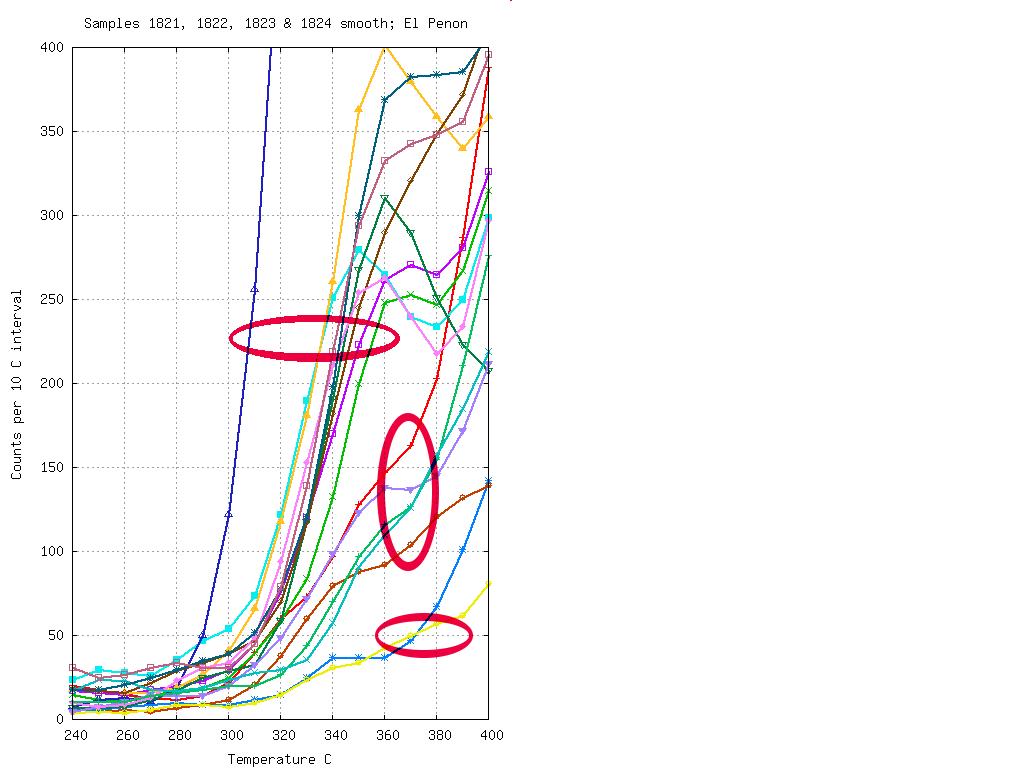
A plot of all these results on one graph shows 3 separate types
of sample, based on their CO2 levels as indicated by the
decrepitation near 350 C. 10 samples have distinct peaks caused by
substantial CO2, 5 samples have modest CO2
contents and only 2 have no detectable CO2. These
sample groupings are shown on the following diagram which accentuates
the low temperature decrepitation region.
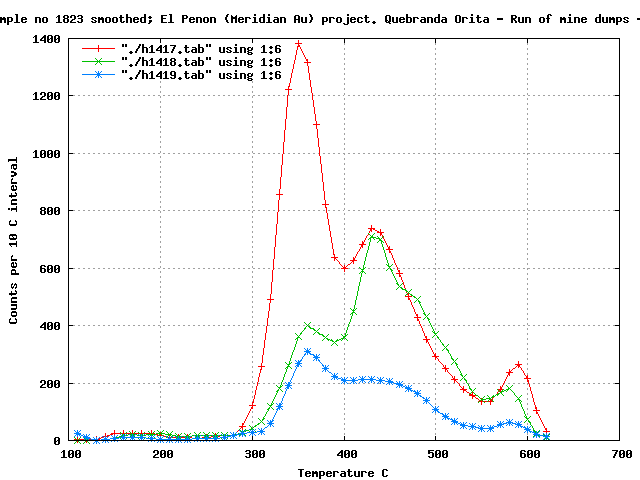
The triple peak response from El Penon samples is
typical
of samples from Au deposits where CO2 rich fluids
occur.
In this case the lowest temperature peak at 350 C is quite high, based
upon which we infer that the partial pressure of CO2
in
this system is quite low. (In archaean Au systems this first peak is
often
near 250 C.) Samples from the Au deposits in Nevada lack CO2
and the consequent low temperature decrepitation peak, so the El Penon
deposit seems to be a high level system, but deeper than typical Nevada
systems. The peak at about 420 C does vary slightly between samples and
suggests it may be possible to map out palaeo-thermal gradients in
these veins, given a proper spatially located sample suite.
The temperature of the ore forming fluids was about 350 C. As all of
the
samples collected were from the "run of mine" dumps we inspected, it is
impossible to infer any spatial relationships from these samples.
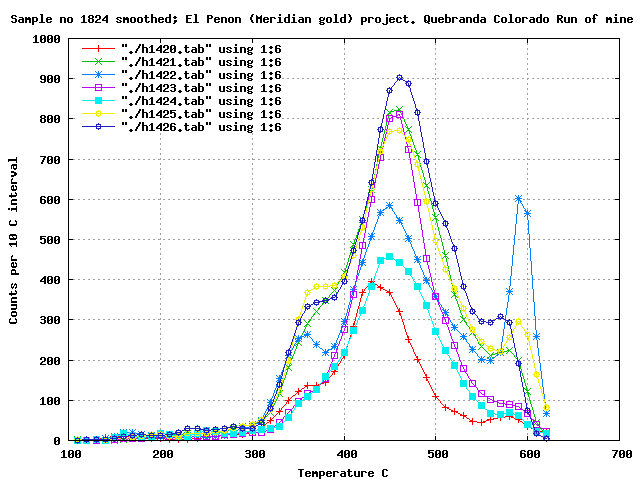
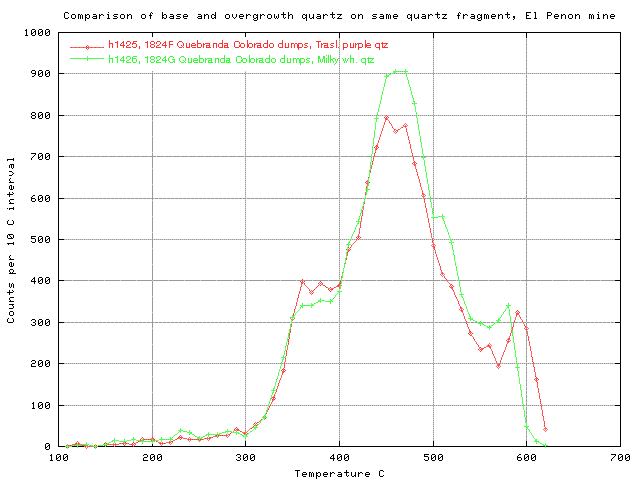
Two of the samples collected showed strong quartz
zonation
with the fragment (about 2 cm across). Each of these samples was split
into
an early milky quartz and a late stage, clearer and more coarsely
crystalline
overgrowth quartz. In the above plot of samples 1824F and 1824G, these
two types of visually distinct but very closely associated quartz,
showed
no discernible difference in fluid inclusion content. (The other sample
pair showed the same self-similarity.) This confirms the
interpretation
that the El Penon system was formed during a single thermal event with
remarkably little thermal variation within the system either spatially
or temporally.
Concluding Remarks
Decrepitation analyses show that the El Penon Au
deposit
formed from fluids with moderate to low levels of CO2
and with little
spatial and temporal variation across the deposit. The
deposit must have formed at reasonable depth in order to capture these
high pressure CO2 rich fluids. It's origin is deeper than
usual for typical epithermal deposits. Variations in the CO2
contents permit the recognition of several different sample groups,
despite the lack of any visible differences and this information may
well assist in outlining potentially mineralised zones in the veins.
 Applied Mineral Exploration