Four "inter comparison" samples were submitted
for analysis to check the possible interference of CO
2
rich fluids within fluid inclusions with cosmogenic C dating.
Samples were analysed on the
model 215 decrepitometer
and were heated to 800 C, the maximum of the decrepitometer.
Because low level counts were significant, a lower than normal
threshold was used to provide better sensitivity. However the
setting used (40) was too aggressive and seems to have resulted
in instrumental background interference in some samples. Run
numbers from J89 used the normal threshold setting of 60. In
addition, some extraneous counts occurred at times, mostly from
the "right" furnace. Consequently some of the results for
decrepitation between 600 and 800 C are thought to be uncertain.
Many additional tests were done to establish the instrumental
background using previously decrepitated sample, which should
give no counts. Tests were also done using the standard
laboratory calibration sample. Two samples (CRN & CO) were
analysed twice and one sample (CRA) was also crushed to a finer
grainsize of <200 microns, >120 microns and analysed to
check for grainsize effects.
The graphs of the data are all smoothed using a weighted rolling
mean smoothing over 3 samples weighted 25%, 50%, 25%. Two plots,
as stated in the title line, show the raw data results (ie not
smoothed) to better show the background variations.
Another approach might be to analyse some quartz
samples collected from deep underground
( > 50 metres depth) in which there would be no cosmogenic
carbon content. Four samples collected from 2 mines (Dongping
and Hougou) in china in 2005 were retrieved and analysed again
by decrepitation as potential candidates for further tests.
These samples have been stored in the laboratory since 2005.
Results
Cosmogenic sample comparison tests
Samples CRN and CO were analysed twice. The first analysis of
sample CO (run J71) is thought to be incorrect and is omitted
here.
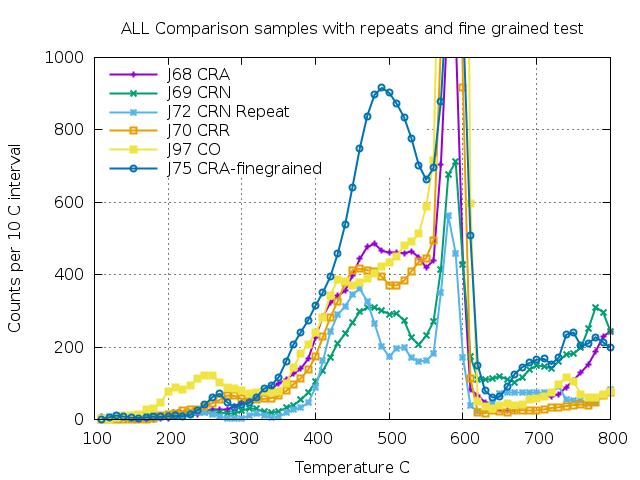
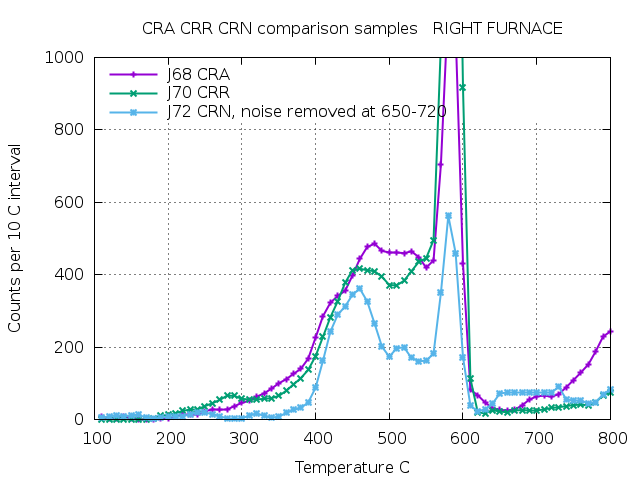
Sample CRR (brown) shows the expected absence of fluid inclusion
decrepitation above the 573C quartz transition.
Sample CO (J97) (yellow) also shows the absence of high
temperature decrepitation, but there is a small peak at
750C. It should not be, but may be instrumental
interference.
Sample CRA (magenta, J68) shows increasing decrepitation to 800
C, probably due to fluid inclusions. The fine grained
re-analysis of this sample (blue, J75) shows a similar
decrepitation increase to 800 C, confirming that this is due to
fluid inclusions. These inclusions are present despite the
sample grainsize being finer (<200 microns, >120 microns).
Sample CRN (green and cyan, J69 & J72) gives conflicting
results. J69 shows increasing decrepitation to 800 C, but the
reanalysis. J72 does not. There was instrumental interference on
J72 from 650 to 720C which has been manually removed in this
plot. It is uncertain, but probable that there is no significant
decrepitation above 573C on this sample.
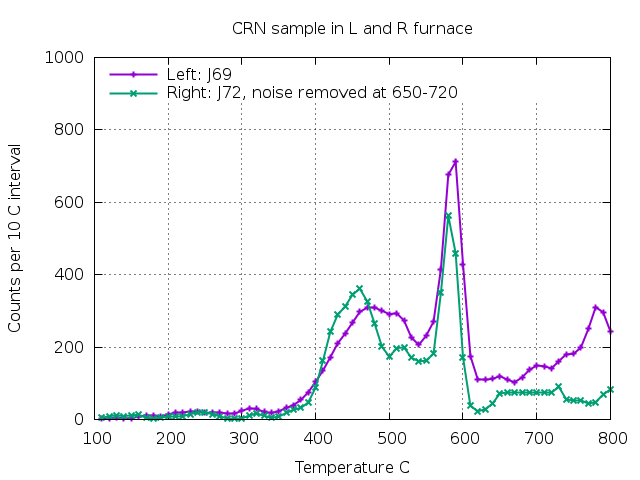
The 2 analyses of CRN show unusually poor correlation. The peaks
at 450 - 660 C show a low-moderate abundance of fluid
inclusions. The rise in decrepitation to 800 C in J69 seemed to
be real, but the reanalysis as J72 lacks this decrepitation.
Note that there were instrumental problems on run J72 and
interference between 650 and 720 was manually removed. Despite
this interference, decrepitation was low from 750 to 800 C and
does not confirm the high temperature decrepitation on run
J69. Consequently the high temperature decrepitation on
sample CRN is uncertain and possibly only at background.
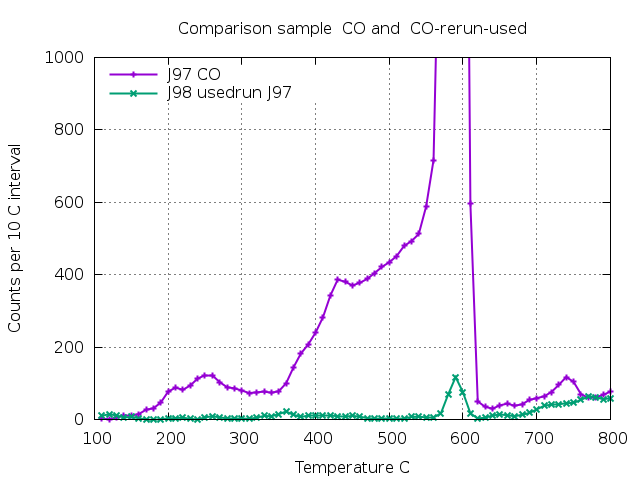
The initial analysis of sample CO (J71) showed suspiciously high
counts at 800 C and was re-analysed as J97. This analysis shows
very low decrepitation above 600 C. A small peak at 750 C is
most likely real but is close to background levels. The used
sample was re-analysed as J98 to show the background level. The
small peak at 590 C is due to a few inclusions which survived
the first heating run. Some inclusions do manage to survive
intact despite being heated beyond the 573 transition. The
gradual increase in level from 700 to 800 C on run J98 is most
likely the instrumental background rather than fluid inclusion
counts.
Two furnaces are used in alternation in operation of the
decrepitometer. During analysis of sample CRN, run J69, in the
left furnace, it seemed that there may have been instrumental
interference above 600 C and it was re-analysed as run J72 in
the right furnace, plotted in the next diagram. Analysis
run J72 shows no significant decrepitation above 600 C and is
considered more reliable than the run J69 result for sample CRA.
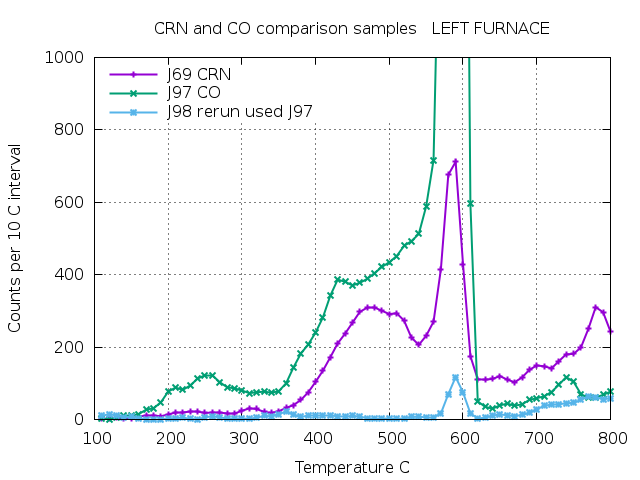
After adjustments to this furnace this interference was
eliminated and analyses of sample CO, runs J97 and J98 gave
acceptable results.
Sample CRA, run J68, shows a significant decrepitation increase
near 800 C. This result was confirmed by the re-analysis of the
fine-grained fraction of sample CRA plotted below (run
J75).
Sample CRR, J70, shows low counts above 600 C as expected. A
repeat analysis of sample CRN was carried out as run J72.
(Previous analysis J69, plotted above) There was severe
instrument interference in run J72 from 650 to 720 C and this
has been removed from this plot. This repeat analysis shows no
significant decrepitation above 720 C and is considered to be a
more reliable analysis than run J69 of sample CRN.
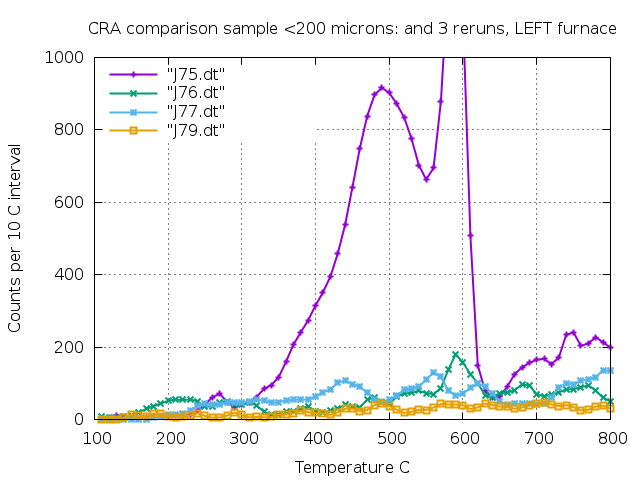
It was thought that the results might be influenced by the
grainsize of the analytical sample. All the original analyses
were carried out on samples with grainsize sieved to -500+212
microns. There was enough of sample CRA to permit further
crushing and sieving to give a sample with grainsize <200
microns with fines of about less than 120 microns removed. This
sample was analysed as run J75. The used sample from this
analysis was also re-analysed 3 times to verify the background
level and instrument performance. The first re-analysis (used)
was run J76 which shows a small peak at 590C due to survival of
a few inclusions through the first analysis. Subsequent
re-analyses (used) of J77 and J79 show background level and the
absence of any peak at 590C. It is clear that a few inclusions
do survive the first heating cycle to 800C, but no inclusions
survive the second or third heating of the same material.
The decrepitation increase to 800C on run J75 confirms the
result seen on the coarser grainsize fraction of the same
sample, run J68 plotted above. Reducing the grainsize of the
sample has not made any significant change to the analytical
result. Inclusions do survive heating through the 573 C
transition temperature on this sample.
Calibration and annealing tests
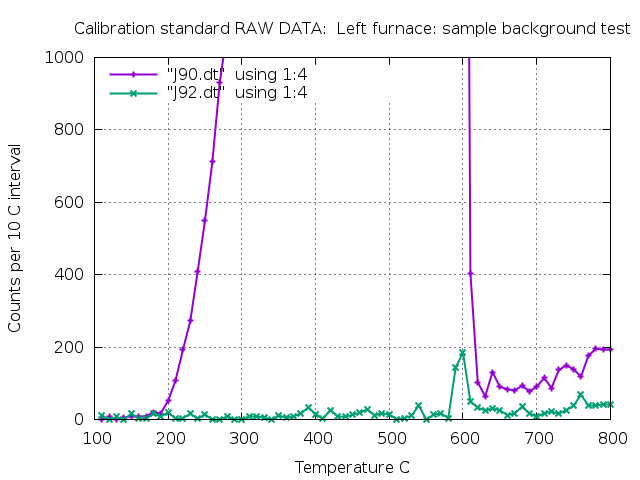
The calibration standard is a sample of quartz from the Howley
gold mine near Darwin which is analysed frequently to check the
instrument operation and precision. Run J90 shows a small
increase in decrepitation near 800 C. Run J92 is a re-analysis
of the used sample from run J90 and shows a small peak at 600 C
which is caused by fluid inclusions which survived heating
through the quartz alpha-beta transition temperature of 573 C
right up to 800 C during run J90. Run J92 shows only background
counts above 600 up to 800 C with no detectable further
inclusion decrepitation.
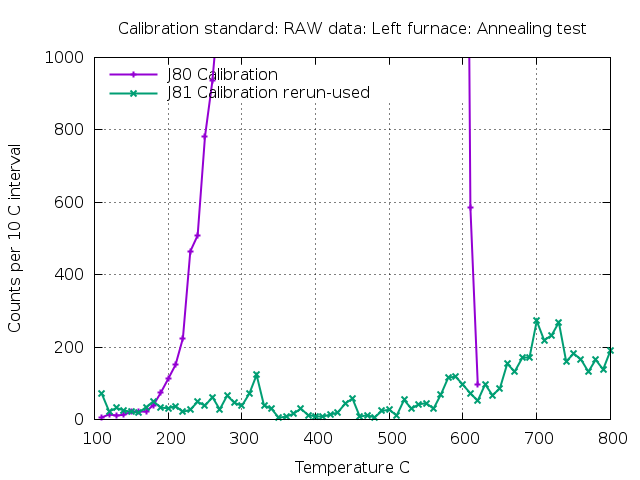
Two additional analyses were carried out on the calibration
standard to see if heating to only just through the alpha-beta
transition temperature is enough to eliminate inclusions up to
800 C. Run J80 heated the sample only to 620 C and the sample
was then cooled to room temperature and the used sample was
re-analysed to 800 C as run J81.
Heating to 620 C , above the alpha-beta transition temperature,
does not "anneal" the quartz and remove all inclusions. The
subsequent analysis to 800 C still shows the small high
temperature decrepitation to 800 C as seen on run J90 in the
previous plot. The difference in response between 620 and 800 C
on these two analyses (run J90 and run J80) may be due to sample
aliquot differences but may include some component of
instrumental error. It is very difficult to get accurate data at
such low count levels at high temperature which may contribute
to this small change.
Underground samples from mines in
china, extracted 2005
Samples from deep underground should contain no cosmogenic
carbon and may be useful to check if fluid inclusion CO2
interferes with cosmogenic carbon measurements.
Four samples were retrieved from the archives and
analysed as potential check samples. The four samples of
quartz from 2 underground mines in NE China (Hebei province)
were first analysed in 2005 and have H series run numbers.
These are plotted using thin lines. These samples were
reanalysed on the new decrepitometer with J series run numbers
and plotted with thick lines. The duplicate analyses are in
agreement and differ in amplitude due to the improved
sensitivity of the updated model 215 decrepitometer. The
H series analyses were done on the model 105 decrepitometer.
Samples from the Dongping mine were collected from the "70"
ore body at a depth of approximately 300m below surface. The
sample from the Hougou mine was collected from a depth of
approximately 30m below surface.
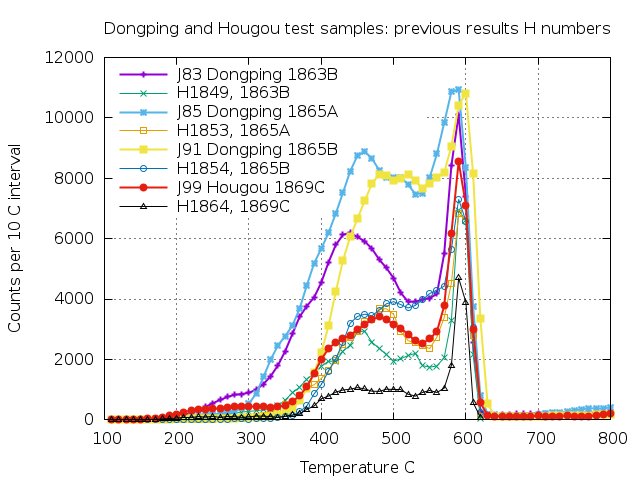
Traces of CO
2 are present in samples 1863B, 1865A and
1869C based on the decrepitation counts seen between 200 and 300
C.
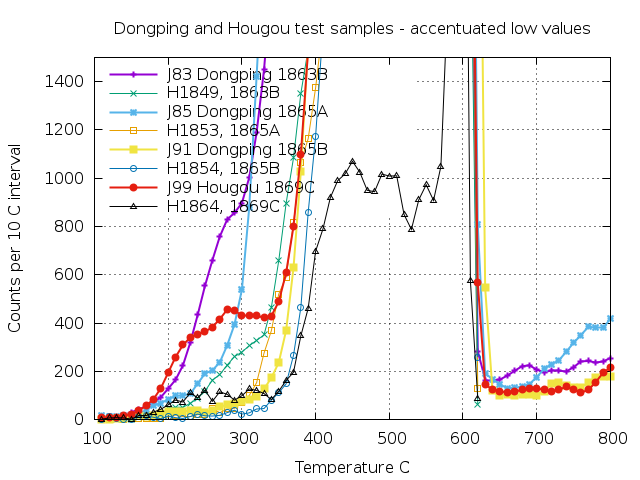
This plot shows the same data as the above plot with the Y axis
scale expanded to more clearly show the low level counts above
600 C.
Dongping samples 1863B and 1865A have minor decrepitation above
600 C to 800C which may be due to fluid inclusions which
survived the alpha-beta quartz transition at 573 C.
Dongping sample 1865B (yellow) and Hougou sample 1869C (red)
show only low level decrepitation above 600 C which cannot be
distinguished from backgound levels.
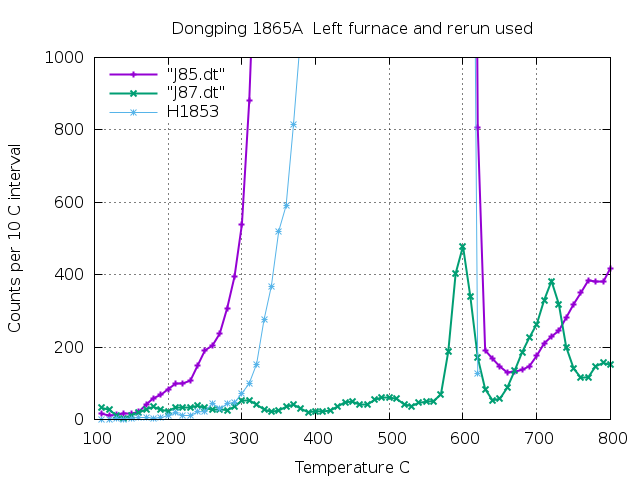
Sample 1865A does show significant decrepitation from 650 to
800C. The rerun of used sample (J87) shows a small peak at 600 C
due to survival of some inclusions. The peak at 720C in run J87
is diabolical as decrepitation of the used sample should be at
background level and should not exceed the decrepitation level
of the original fresh sample J85! This may be interference due
to the excessively sensitive threshold setting used.
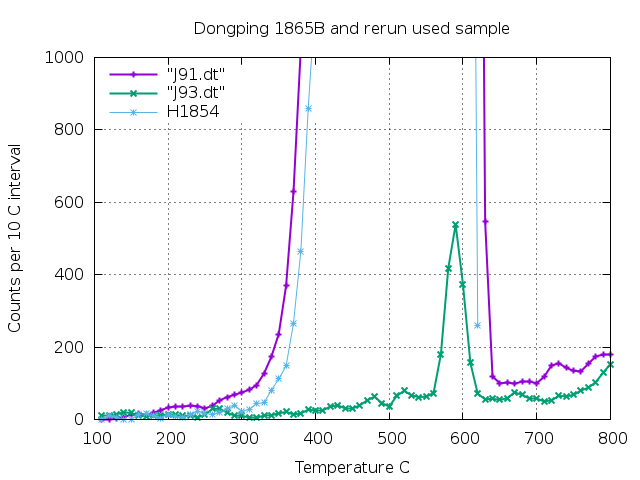
Sample 1865B shows only trace or no decrepitation above 650 C
and the analysis J93 of the used remains of J91 show normal
background.
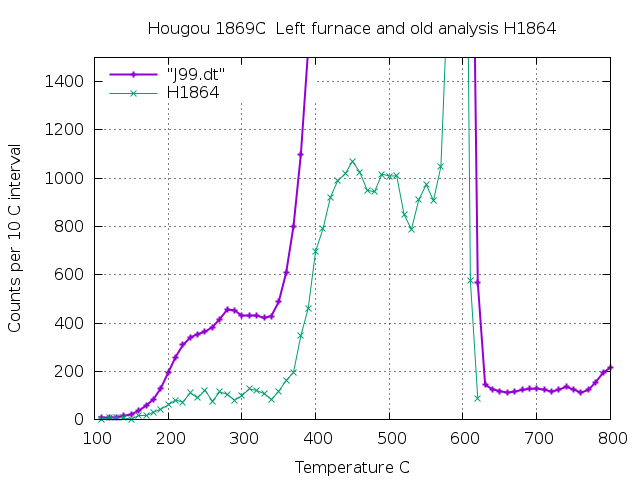
Sample 1869C from the Hougou mine shows no significant
decrepitation above 600 C with only background levels.
Samples 1863C and 1869B are the cleanest white quartz samples of
the 4 samples. Samples 1865A and 1865B contain perhaps 1%
of darker grains and may need heavier pre-cleaning.
Sample
details and analytical run number list
 Applied Mineral Exploration