Newest
Topics:
For the latest news, see the NEWEST TOPICS page.
Google is too dumb to let me put the list of news in this column and falsely claims that all my pages are self-duplicates.
Google-NONSENSE
Google's so-called "Artificial Intelligence" is an abuse of the concept of intelligence!
Acoustic
Decrepitation as a means of rapidly determining CO2
(and other gas) contents in fluid inclusions and its use in
exploration, with examples from gold mines in the Shandong and Hebei
provinces, China.
Kingsley
Burlinson
Acta Geologica Sinica
Abstract
The
acoustic decrepitation
method heats a small monomineralic sample
and counts pressure impulses as the inclusions burst when they
develop high internal pressures. For aqueous fluids, the
decrepitation temperature is correlated with the homogenisation
temperature, but gas rich fluids give a distinct and characteristic
low temperature decrepitation peak which can be used to recognize gas
rich fluid inclusions. This information is useful in exploration for
Au deposits, which are frequently associated with CO2
rich and sometimes CH4
rich fluids.
This
distinctive decrepitation occurs because the CO2
rich inclusion fluids expand according to the gas law and develop
internal pressures high enough to burst the host mineral grain at
temperatures well below their homogenisation temperatures. In
contrast, aqueous fluids condense to a liquid and vapour phase during
post-entrapment cooling. Upon subsequent heating their internal
pressures do not increase significantly until after homogenisation to
a single phase occurs and hence they do not decrepitate
"prematurely" as gas rich inclusions do.
This
behaviour is usually regarded as an annoyance in conventional
microthermometric homogenisation studies,
but can readily be used as an exploration aid to find mineralisation
deposited from such gas rich fluids. Decrepitation results on samples
from Cowra Ck, NSW, Australia, which have also been
microthermometrically measured for CO2
content, show that amounts of less than 5 mole
% CO2
are easily distinguished by decrepitation and amounts as low as 1
mole % CO2
may
be determinable.
Examples of the use of
acoustic decrepitation in the study of 6 gold mines in the Shandong
and Hebei provinces of China are discussed.
The
fluid inclusion decrepitation method was first used in the 1940's as
a method to measure homogenisation temperatures. The method was soon
replaced by microthermometry which was
recognized as being more accurate for determining these temperatures.
However, it was not understood that much of this early decrepitation
work was subject to interference caused by the presence of CO2
rich fluid inclusions. Consequently much of the criticism of the
technique, which led to its demise for academic research purposes, is
now known to be inaccurate. The technique was subsequently used in
Russia and China in the 1970's in exploration programmes, in which
economical and rapid analyses are more important than modest
inaccuracies. However, even this work failed to realise the effects
caused by the presence of CO2
rich inclusions. It was not until 1983 (Burlinson, 1984) that the
effect of CO2
rich fluid inclusions upon decrepitation data was recognized. Such
CO2
rich fluid inclusions develop high internal pressures at low
temperatures resulting in decrepitation long before the inclusion
reaches homogenisation temperature. This behaviour is frequently
observed in microthermometric studies where it is a major problem
when trying to measure the homogenisation
temperature. However, this decrepitation gives rise to
distinctive low temperature peaks on the acoustic decrepigrams
which can be used to recognise the presence of CO2
rich fluid inclusions. This led to the recognition that CO2
measurements by acoustic decrepitation could be used as an
exploration technique for Au deposits, which are often associated
with CO2
rich hydrothermal fluids.
Confirmation
of the relationship between low temperature decrepitation and CO2
rich fluids was provided in 1995 by Mavrogenes et al. (Mavrogenes,
J.A. et al., 1995), who used quadrupole
mass spectrometric analyses of gases released from fluid inclusions
from samples from the Cowra Creek goldfield in NSW, Australia. In
this work, 5 samples with prominent low temperature decrepitation
peaks were shown to give rise to CO2
rich gases when the fluid inclusions were opened either by sequential
heating or mechanical crushing of the same samples.
Following
from this work, acoustic decrepitation is now a useful exploration
technique for detecting CO2
rich fluids, or in their absence, for measuring Td (temperature of
decrepitation). Although it is not a high accuracy technique it is
ideal for exploration because it does not require the preparation of
polished thin sections and is a rapid and cheap method which has been
automated using modern computers and electronics (Burlinson, 1988).
Because the method uses a relatively large sample (0.5 grams) and
counts many inclusions (often more than 100,000) in each sample, it
provides representative and statistically meaningful
data which can be difficult to match with microthermometric analyses
and this is of fundamental importance in its application as an
exploration tool.
2 Decrepitation
of gas-rich inclusions
2.1 Explanation
of decrepitation
To
understand the decrepitation behaviour of
aqueous CO2
rich inclusions, it helps to realise that the unusual fluid is not
actually CO2,
but water. In the 50 to 600 C temperature range and 1 bar to 3 Kbar
pressure range of interest for Th (temperature of homogenisation)
measurements, CO2
does not change phase and behaves according to the Gas law (PV=nRT)
with only minor variation due to non-ideallity. CO2
rich inclusions often have high internal pressures even at room
temperature, their internal pressures increase linearly with
temperature when they are heated and they will rapidly develop enough
internal pressure to cause decrepitation. However, water exists as
both a liquid and a vapour phase under these conditions and changes
between the liquid and vapour phase depending on the pressure and
temperature. Because of the existence of
both liquid and vapour phases in most aqueous inclusions at room
temperature, inclusion pressures are low until homogenisation to a
single phase occurs at Th. Only above Th and only if the inclusion
homogenises to a liquid phase, will aqueous inclusions be able to
develop enough internal pressure to cause decrepitation.
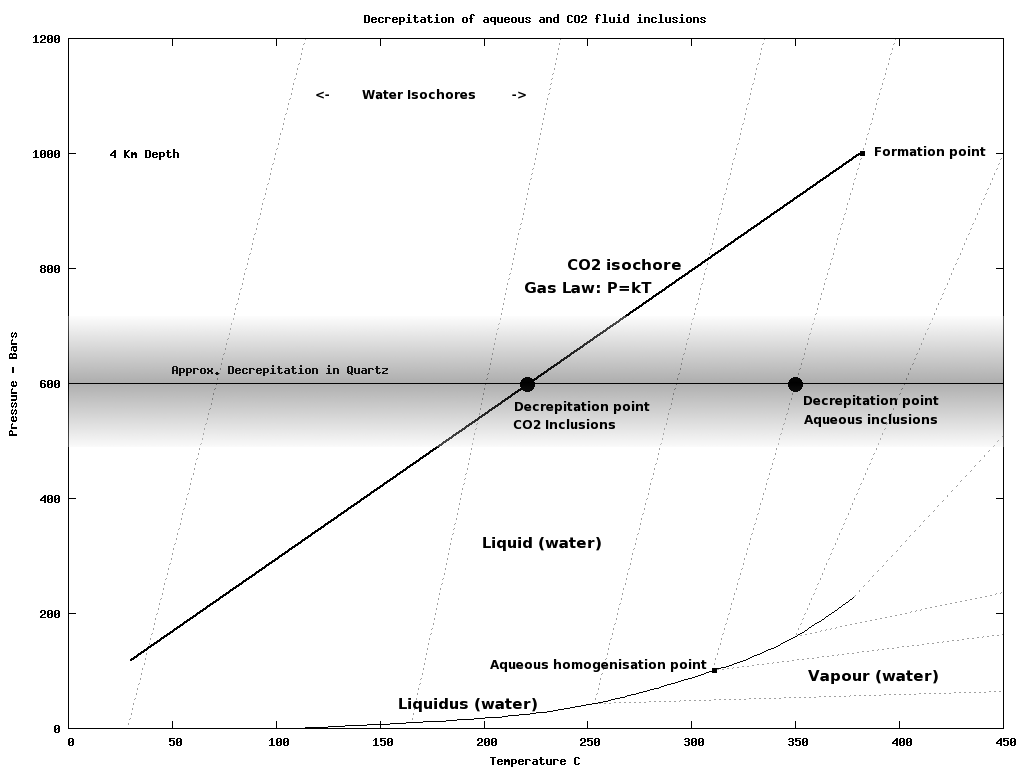
This
is easily seen in figure 1. Consider a pair of inclusions formed in
quartz at about 380 C and 1 Kbar pressure. (Shown as the formation
point in figure 1). One inclusion is comprised of water (of low
salinity) with no CO2
and the other inclusion is of CO2
with no water. At these conditions the aqueous inclusion is a liquid
and the CO2
inclusion is a gas, highly compressed and of high density. As the
aqueous inclusion cools, it follows the water isochore
down to the vapour liquid curve at the homogenisation point. It then
nucleates a vapour bubble and on further cooling it follows the
vapour liquid curve back to room temperature and pressure, the volume
of the vapour phase increasing and the liquid phase contracting as
the inclusion cools. At room temperature the internal pressure of the
aqueous inclusion is near zero bars.
In
contrast, as the CO2
inclusion cools it will follow a PT path along the bold line which is
determined by the gas law, PV/T = k, where k is a constant. As the
volume of the inclusion is constant, this is equivalent to a path of
P = k' T (non-ideal behaviour is minor and can be ignored). CO2
does not condense to a liquid until below 31 C, its critical point
temperature. CO2
inclusions at room temperature typically have high internal
pressures. (Pressures of at least some 40 to 70 bars are required to
give a liquid CO2
phase at room temperatures.)
During
cooling from their formation conditions, there is a confining
pressure on the quartz host mineral similar to the internal pressure
of the inclusions, so the inclusions will not burst. But when
observed and heated in the laboratory, the confining pressure on the
quartz host mineral is only 1 bar. During heating the inclusion
conditions follow the same pathways as when they cooled and soon
develop internal pressures sufficient to break the quartz now that it
has only 1 bar of confining pressure.
A
very approximate estimate of the overpressure needed to break the
quartz is shown by the shaded pressure band between 500 to 700 bars.
Although previous work (Leroy, 1979; Bodnar et al., 1989) has
suggested that internal pressures of 850 bars or even up to 2000
bars are needed for inclusions in quartz to decrepitate, these
studies were concerned only with well preserved inclusions remote
from and unaffected by any discontinuities in the quartz such as
fractures, grain boundaries or other fluid inclusions. In actual
analytical samples the quartz is structurally heterogeneous
and inclusions can decrepitate at far lower internal pressures,
estimated to be about 600 bars. It is likely that only those
inclusions near quartz grain surfaces or fractures are able to
decrepitate, and they do so at lower than theoretical internal
pressures because the quartz near these inclusions is mechanically
weak. Inclusion abundance counts on a sample with inclusions of
maximum size 10 microns suggest that only a very small number (less
than 1%) of the inclusions larger than 5 microns gave rise to
detectable decrepitation events and that none of the inclusions
smaller than 5 microns decrepitate.
In
Fig. 1 the aqueous inclusion will generate little internal pressure
during heating as it progresses up the vapour-liquid equilibrium
curve to the homogenisation point. At this temperature the liquid has
expanded to fill the inclusion and there is no longer a vapour
bubble. Upon further heating the inclusion progresses up the water
isochore (dashed line) passing through the homogenisation point, at
320 C in this case. The liquid rapidly develops a high internal
pressure as it tries to expand within the fixed volume of the
inclusion and by 350 C has developed enough pressure to burst the
quartz host grain. The observed decrepitation temperature of 350 C is
acceptably close to the original formation temperature of 380 C, and
acoustic decrepitation observations on aqueous inclusions can be used
as a reasonable indicator of the formation temperature.
For
the CO2
inclusion, the pressure immediately starts to increase as it is
heated, progressing along the PT line shown in bold and by 220 C the
internal pressure is sufficient to burst the host quartz grain. The
observed decrepitation temperature of 220 C is a poor indicator of
the formation temperature of 380 C. However, the very low temperature
decrepitation is characteristic of the presence of CO2
fluid inclusions and is easily measured using the acoustic
decrepitation technique.
Fig.
1 P-T diagram for water and CO2
gas, showing decrepitation pressures. CO2
rich inclusions decrepitate at very low temperatures.
Mixtures
of CO2
and water within an inclusion will give results intermediate between
these 2 end-point cases (Shown here). Precise calculations based on the mole
fraction of CO2
present will depend also on the solubility of CO2
in the aqueous phase, and this in turn will depend upon the salinity
of the aqueous phase. However it is clear that as CO2
is added to an aqueous system the decrepitation temperature will be
lowered, and perhaps substantially so. It is this lowering of the
decrepitation temperature with the increase of CO2
in the system that is easily measured by the acoustic decrepitation
method making it a useful exploration tool in finding interesting
hydrothermal systems with significant amounts of CO2-rich
fluids. Such CO2-rich
fluid systems are frequently associated with gold mineralisation.
(Burlinson, 1991; Mavrogenes et al., 1995; Partamies &
Poutiainen, 2001, Lowenstern, 2001).
Pure CO2
fluids are uncommon and most inclusions contain CO2
and water and perhaps some NaCl . Methane and nitrogen are less
common additional constituents. The addition of other non-condensable
gases such as methane and nitrogen does not change the decrepitation
behaviour, as these gases also follow the gas law equation during
heating and cooling. Different chemical species of gases do not have
different P-T expansion properties, the minor differences due to
non-ideallity have no significant effect
upon the decrepitation behaviour of inclusions. The addition of
solutes to the aqueous phase tends to suppress the solubility of CO2
and so increase its pressure in the gas phase, causing slightly more
lowering of the decrepitation temperatures.
Real
fluid inclusions vary greatly in their size and morphology. This has
a major effect on the decrepitation behaviour as large or angular
inclusions can more easily break the host quartz grain. While aqueous
inclusions are often 5 to 20 microns across and somewhat rounded, it
is common for CO2-rich
inclusions to be quite large (50 or more microns) and extremely
irregular with sharp points. The stress concentration at these points
on the inclusions makes it much easier to break the host quartz
grain. This accentuates the lowering of decrepitation temperature by
CO2-rich
fluids as they are able to decrepitate at even lower pressures.
If
the inclusions are formed at low pressure (epithermal
environments), they may not decrepitate at all. And low density
water inclusions ("steam") may homogenize to a vapour phase
instead of a liquid and these would never develop enough internal
pressure to decrepitate. This agrees with decrepitation measurements
on high level systems in which it has been found that decrepitation
is usually very weak or absent.
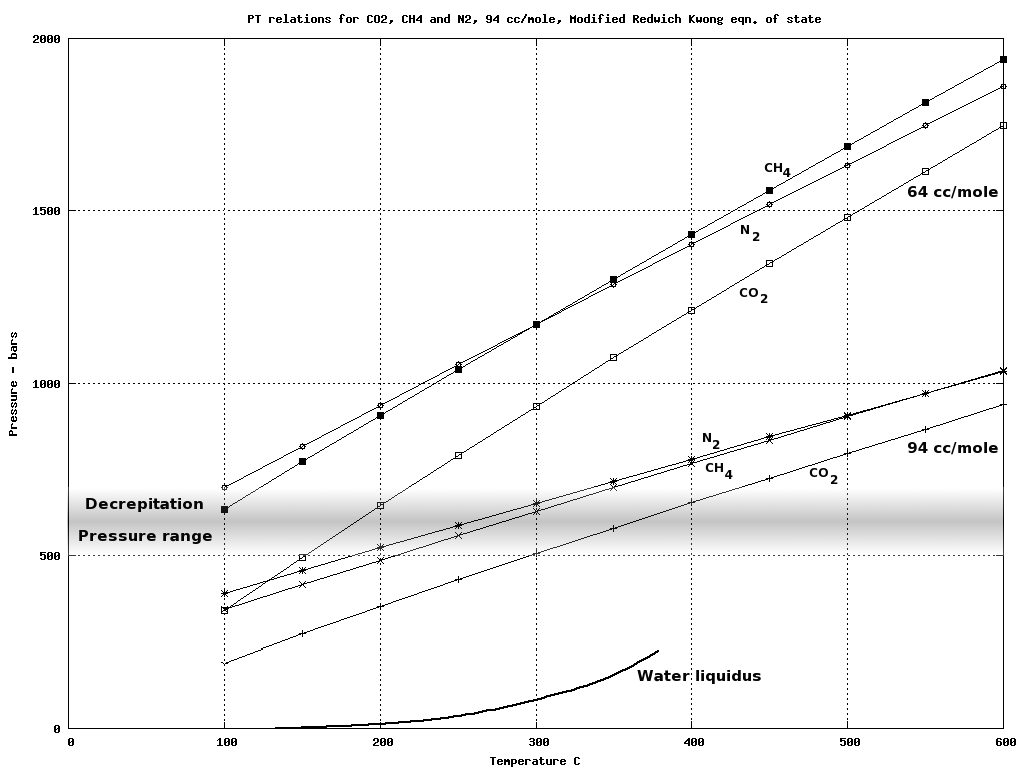
To
demonstrate the similarity of decrepitation behaviour for different
non-condensable gases, the equation of
state calculations for CO2,
N2
and CH4
are shown in figure 2. This was calculated using the Redlich-Kwong
equation of state (Redlich and Kwong, 1949) as modified by de Santis
(de Santis et al., 1974) using a computer program by Holloway
(Holloway, 1981). From this data it can be seen that inclusions of
any of these gases formed at the same PT conditions (and thus having
the same molar volume) will behave similarly in respect of their
decrepitation when heated. The small differences due to non-ideallity
of the gases do not result in a significant alteration to the
decrepitation behaviour of the inclusions. Consequently the
decrepitation method is not compromised by the presence of N2
or CH4
mixed with CO2
and will respond equally to any mixture of these gases.
Fig.
2 P-T diagram for CO2,
CH4
and N2
using the modified Redlich & Kwong equation of state. Neither the
different gases nor variations from ideal gas behaviour affect the
decrepitation behaviour.
2.2 Interpretation
of decrepigrams
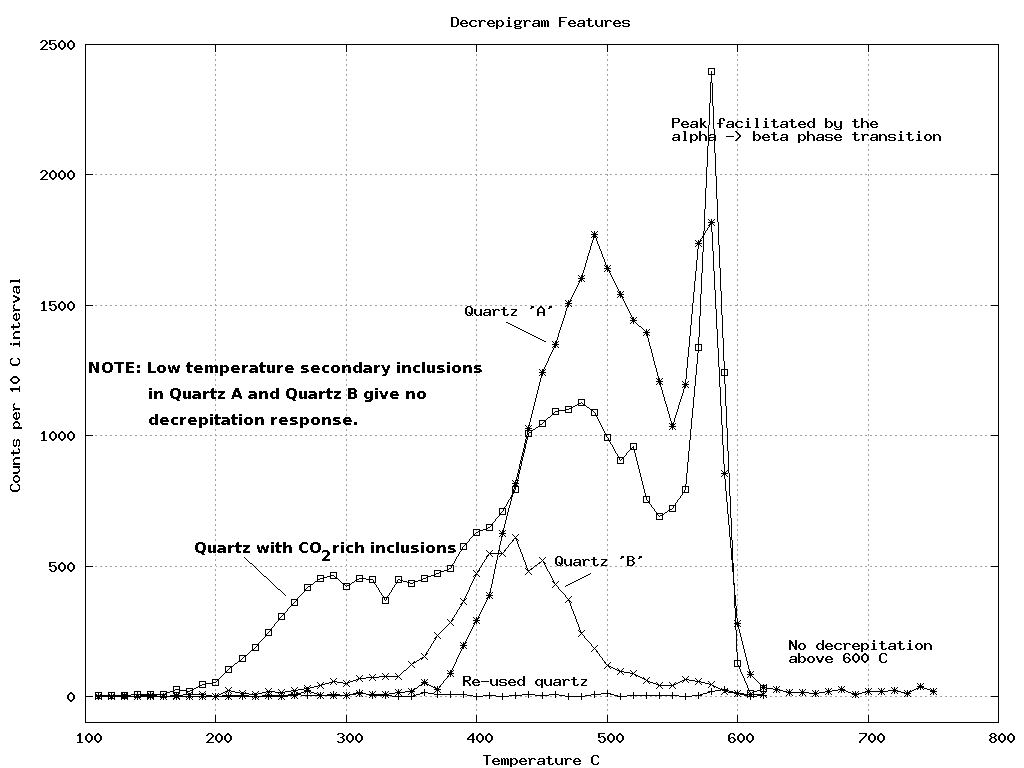
Some
typical decrepigrams of quartz samples are shown in figure 3.
Fig.
3 Typical decrepitation results from quartz showing features relevant
to the interpretation of decrepigrams.
Quartz
B in this example begins to decrepitate at 350 C and shows only a
single decrepitation peak with a maximum at 420 C. Quartz A begins to
decrepitate at 390 C and has 2 peaks, with maxima at 490 C and 580 C.
The beginning of decrepitation can be used in these examples as an
estimate of the homogenisation temperature of the quartz and these
two quartz samples formed at different temperatures. The second peak
in quartz A, at 580 C, is related to the alpha-beta phase transition
in quartz. The crystallographic transition itself does not cause the
observed counts, or we would also observe this peak in Quartz B,
which is not the case. At this transition temperature the Young's
modulus of quartz decreases markedly, which facilitates the
decrepitation of inclusions already close to bursting. Because of
the acoustic configuration of the instrument, it is impossible for
the very small crystal volume change of the quartz as it changes from
alpha to beta phase to produce a detectable pressure pulse. At
temperatures above 600 C there is no decrepitation in quartz as all
inclusions capable of decrepitating did so
at the transition temperature when the quartz was physically weak.
Neither quartz A nor quartz B show any significant decrepitation at
low temperatures from 100 to 300 C, although this is the range in
which secondary inclusions would be opening, leaking or
decrepitating. It is thought that secondary inclusions do not give a
response because they either leak rather than burst suddenly, or that
by opening at low temperatures they do not result in the “steam
explosion” of superheated water which is necessary to produce a
detectable pressure pulse in the instrument. (Hladky, 1983) The
analysis of “re-used quartz” was done on a sample which had
already been heated above 600 C, cooled and then re-analysed. On the
second analysis, no decrepitation counts were observed, which
confirms that the counts being measured are catastrophic,
irreversible events like the bursting of fluid inclusions, rather
than any crystallographic or thermal expansion events.
In
contrast to the quartz A and quartz B samples, the quartz containing
CO2
rich
fluid inclusions (as verified by observation in thin section) shows
significant decrepitation at low temperatures, below 300 C. This low
temperature peak is characteristic of CO2
(and other gas rich inclusions) and is a primary means of using the
decrepitation method as an exploration technique.
3 Gas-rich
inclusions in exploration for Au.
It
is commonly observed that CO2
rich fluid inclusions occur in gold deposits of many different types.
(Groves et al., 1988; Goldfarb et al., 1988; Mavrogenes et al., 1995;
Partamies et al., 2001; Garba & Arkande, 1992) Because there is
no known complexing between gold and CO2,
it has been suggested that the relationship is due to the CO2
buffering the fluid pH in a range which enhances stability of the
gold – bi sulphide complex, thus
facilitating Au transport. (Phillips & Evans, 2004; Naden &
Shepherd, 1989) An extensive microthermometric study of fluid
inclusion CO2
contents of ore and non-ore quartz was carried out at the
Hollinger-McIntyre Au deposit in Timmins, Ontario, Canada (Smith &
Kesler, 1985) and it was shown that samples with greater than 4 mole
% CO2
were associated with auriferous quartz, while fluid inclusions from
sub-ore quartz contained less than 4 mole % CO2.
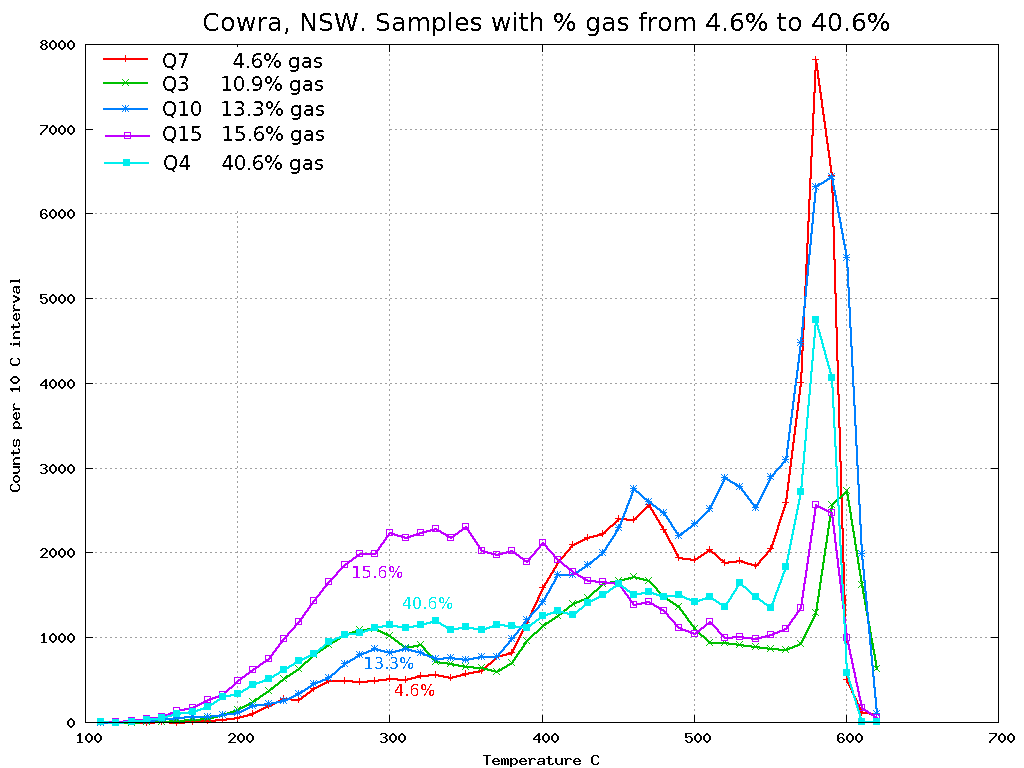
A
comprehensive study of 5 auriferous samples from the Cowra Creek
goldfield, NSW, Australia measured the gas contents of the fluid
inclusions by quadrupole mass spectrometry (QMS) and compared the
results with acoustic decrepitation data on the same samples.
(Mavrogenes et al., 1995) The gases were released from 4 of the
samples by mechanical crushing, and from the fifth sample by
sequential thermal decrepitation. The gases
released were comprised of CO2,
CH4
and N2.
The total mole % of gases released is shown in Fig. 4 along with the
decrepitation results for each of these samples. This shows an
approximate correlation between the total decrepitation counts up to
300 C and the mole % gas results. The main exception is sample Q4,
which had less decrepitation than expected for a sample with 40 mole
% gas. This may be because this sample had an unusually high CH4
content, which may have reacted with CO2
to produce C and H20,
thereby reducing the internal pressure of
these inclusions and reducing the decrepitation. The decrepitation
method easily detected the gas in the sample with just 5 mole % total
gas, and may be sensitive enough to detect
gas contents as low as 1 mole % based on this data.
Fig. 4 Decrepitation results
of 5 auriferous samples from the Cowra Ck. gold district, NSW,
Australia. Mole % total gas measured by quadrupole mass spectrometry
are compared with the amount of low temperature decrepitation.
Although
there are likely to be cases where the CO2
content of inclusions is at low pressure and would not therefore be
detectable by decrepitation, many Au deposit styles are amenable to
the use of decrepitation as a means of quickly and easily providing a
representative and reproducible value for CO2
content which can then be used as an exploration guide. Although not
completely quantitative, this data can be applied in the same manner
as geochemical soil analyses in order to define prospective areas of
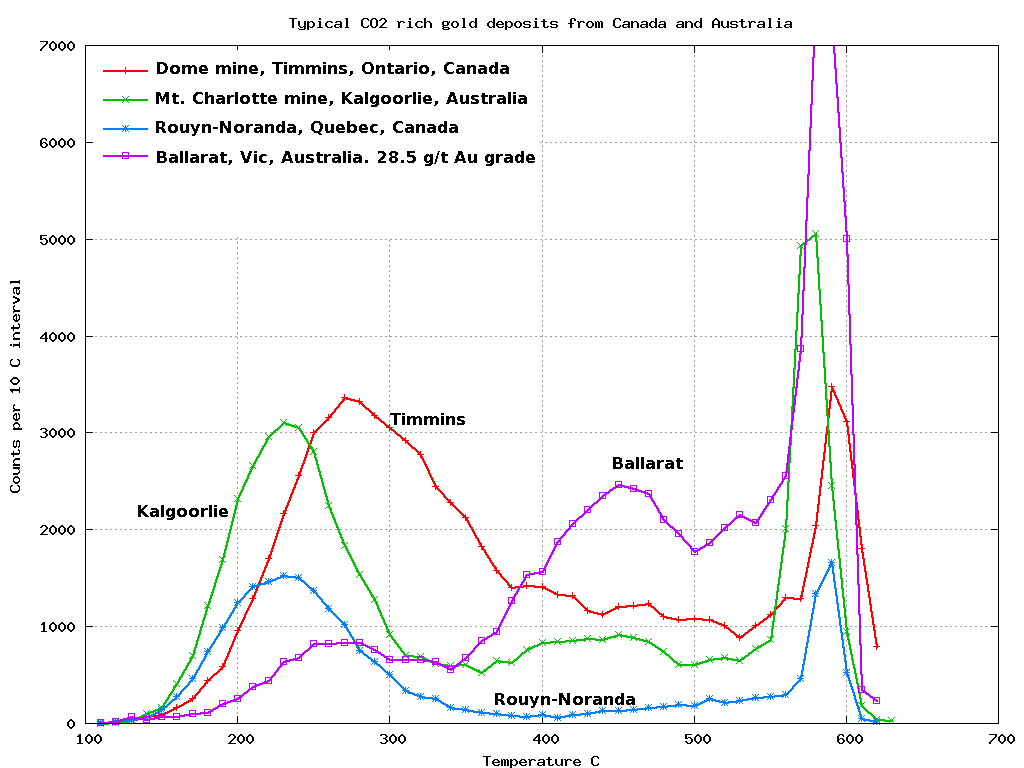
interest. The Au deposits from the Archaean greenstone deposits in
Western Australia, the Abitibi province,
eastern Canada, the proterozoic slate belt
hosted deposits from Victoria, Australia and Nova Scotia, Canada all
contain abundant CO2
rich fluid inclusions which are readily identified in the
decrepitation results. Typical examples of decrepitation results from
these deposits are shown in Fig. 5, showing intense low temperature
decrepitation due to the high CO2
content of these hydrothermal systems.
Fig.
5 Typical decrepitation of gold mineralised samples from greenstone
and slate-hosted deposits in Australia and Canada.
4 Decrepitation
data from Shandong & Hebei mines
A
total of 66 samples were collected from 6 mines in the Shandong and
Hebei provinces in China in August 2005. These samples came from the
Canshang, Jiaojia and Sanshandao mines in Shandong, and the Dongping,
Hougou and Huangtuliang mines in Hebei. Most of the samples were
collected from active ore faces in the mines or from ore stockpiles
to ensure they represented the auriferous quartz. Samples of
approximately 100 to 200 grams were crushed and sieved to obtain 0.5
gm of grains for analysis. These samples were analysed by acoustic
decrepitation using the BGS model 105 decrepitometer
and a selection of representative results are shown in figures 6, 7
and 8.
4.1 Shandong
province
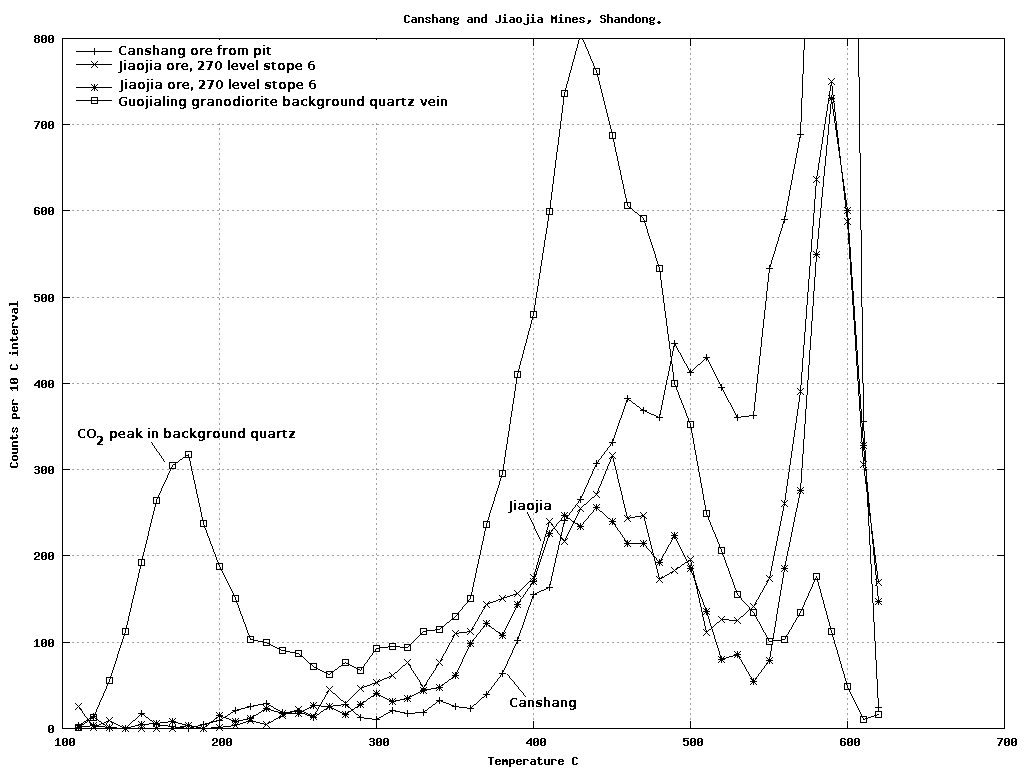
The
sample shown from the Canshang mine in Fig. 6 begins to decrepitate
at about 480 C, while the 2 samples from the Jiaojia mine begin to
decrepitate at about 440 C. This temperature of the start of
decrepitation can be used as an estimation of the homogenisation
temperature of the inclusions and the temperature difference
indicates that the Canshang deposit formed from slightly hotter
fluids than did the Jiaojia deposit. However the most notable feature
of these results is the lack of any decrepitation below 300 C in the
samples from both mines, from which it is inferred that the fluids
lacked significant content of CO2.
This is in contrast with the background (unmineralized)
sample collected from a thin quartz vein within the Guojialing
granodiorite several kilometres away from
the Jiaojia mine. Although CO2
rich fluids do occur in the Shandong region, they are not associated
with the mineralised quartz, but with the barren regional quartz
veins. This lack of CO2
is in contrast to claims that the Au deposits in this province were
formed from CO2-rich
fluids. (Qiu et al., 2002)
Fig.
6 Decrepitation results from the Canshang and Jiaojia mines, Shandong
province, China showing the absence of low temperature
decrepitation and inferring the absence of CO2
rich fluids.
The
differing opinions on the CO2
content of the mineralising fluids may be caused either by the
failure of the acoustic decrepitation method to detect low pressure
CO2
containing fluid inclusions, or by lack of representative sampling
used in the microthermometric studies. It is common for petrologists
to focus their studies on interesting inclusions or large inclusions,
as small inclusions cannot easily be studied. This bias during
observational analysis can lead to
incorrect assumptions about exactly which fluid phase is the host
fluid for the all important Au mineralisation. Almost all quartz is
strongly zoned and formed from many different fluid pulses over a
substantial geologic time interval and it is very difficult when
studying tiny samples to be certain of the exact significance of a
microscopic sample to the megascopic mineralising system. All too
often the interesting CO2
rich inclusions are studied extensively when they represent only a
minor event in a mineralising system which is dominated by boring,
but possibly more relevant, aqueous inclusions. Although the present
acoustic decrepitation data does not conclusively prove that these
fluid systems were CO2
deficient, there is serious concern that CO2
is in fact not a significant component of the fluids in the Shandong
gold deposits.
4.2 Hebei
province
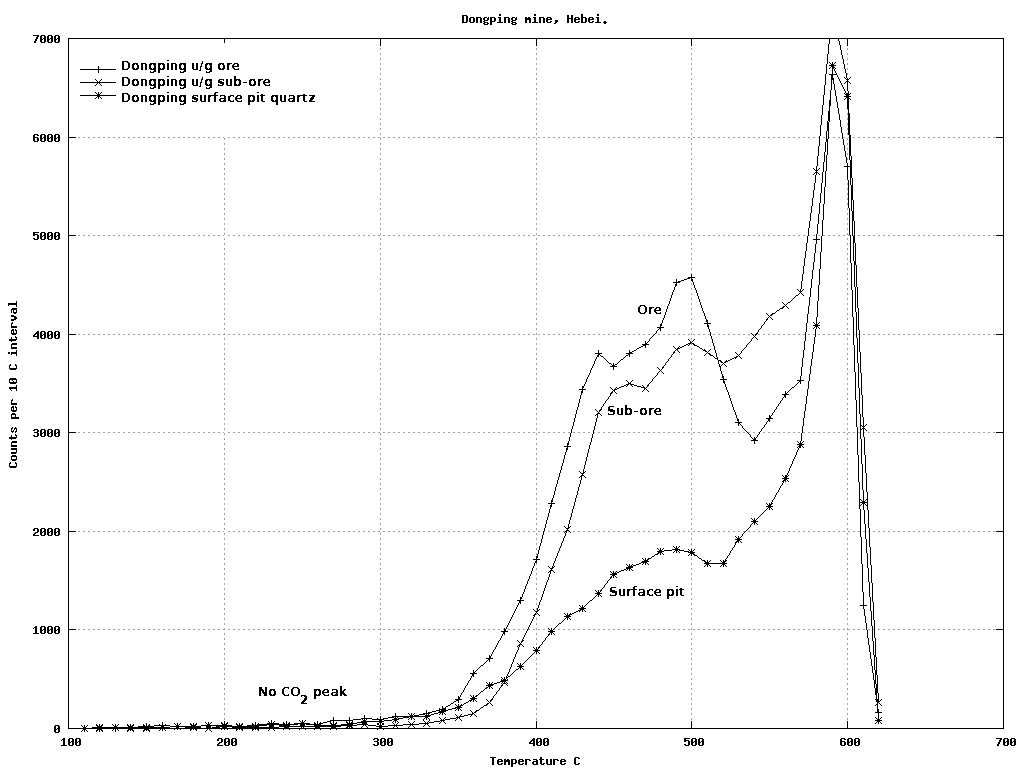
All
of the 20 samples collected from the Dongping mine, (Fig. 7) lack low
temperature decrepitation and are inferred to have no CO2
in the fluid inclusions. However detailed microthermometric fluid
inclusion studies (Mao et al., 2003; Feng-Jun Nie, 1998) have
reported CO2
rich fluid inclusions which have from 4 to 95 mole % CO2
and trapping pressures of 0.6 to 1.2 Kbars. Such inclusions would
give an obvious low temperature decrepitation peak because of their
high internal pressures. The absence of any low temperature
decrepitation indicates that the CO2
rich phases that have been reported are not actually a significant
component of the mineralising fluid system.
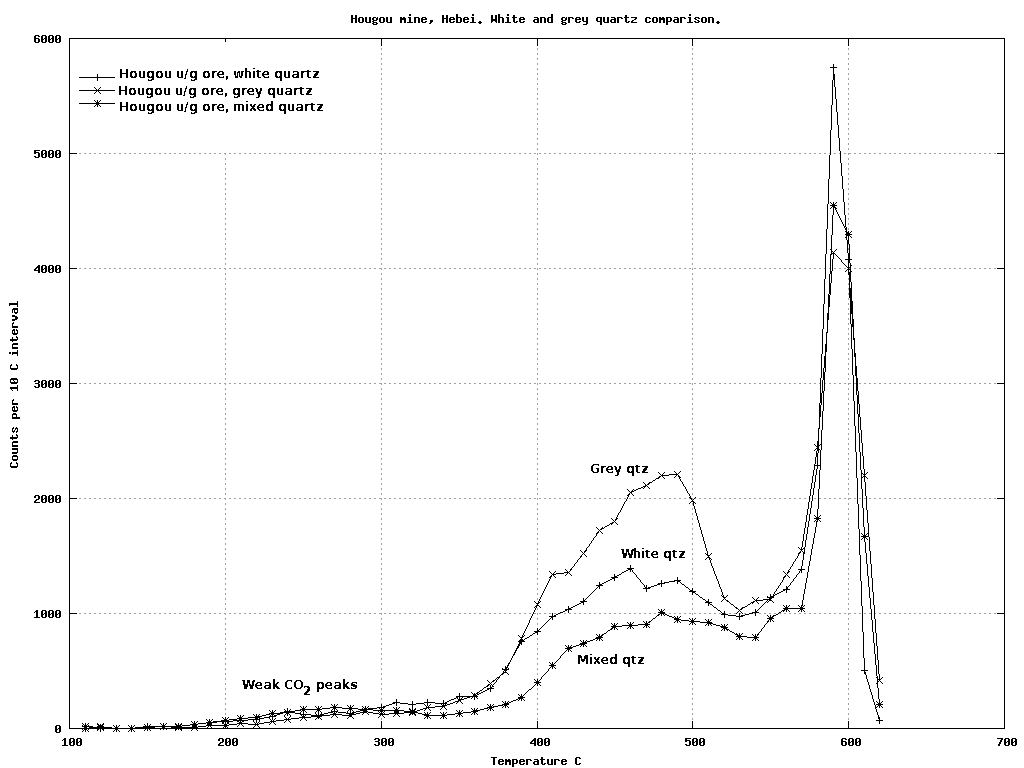
Samples
from the Hougou mine (Fig. 8) show low levels of decrepitation below
300 C and are inferred to contain low levels of CO2
in their fluids. Of the 66 samples collected in Shandong and Hebei,
only these samples from the Hougou mine in Hebei showed any low
temperature decrepitation caused by CO2
rich fluids. Microscope observation of grains of one of these samples
showed that the largest inclusions were less than 15 microns across
and most inclusions were equant and less
than 10 microns across, with some rare elongated inclusions with
maximum dimensions of 15 by 5 microns. Almost all inclusions were 2
phase and most had about 25% vapour, but there was a small quantity
of inclusions with a larger vapour bubbles close to 50% by volume.
Extremely rare 3 phase inclusions with a liquid CO2
phase were observed even though the specimen temperature was 24 C.
These microscope observations confirm the existence
of CO2
rich fluid inclusions and also confirm that they are of very low
abundance, as expected from the decrepitation data.
Fig.
7 Decrepitation results from the Dongping mine, Hebei province, China
showing the absence of low temperature
decrepitation and inferring the absence of CO2
rich fluids.
Fig.
8 Decrepitation results from the Hougou
mine, Hebei province, China showing minor decrepitation at
temperatures below 300 C, confirming the
low abundance of CO2
rich fluids.
No
separate microthermometric study of the
Hougou mine seems to have been reported (in the english literature)
and it is generally assumed that the Hougou and Dongping mines are of
similar genesis. However the decrepitation data indicates that there
is a significant difference in the CO2
content of the hydrothermal fluids at these 2 mines and a separate
study of the Hougou mine is needed as there are major differences
from the nearby Dongping mine.
5 Summary
The
acoustic decrepitation technique has mostly been used in the past to
determine homogenisation temperatures of fluid inclusions. However,
an understanding of the behaviour of CO2,
CH4
and N2
in fluid inclusions shows that the presence of these gases gives rise
to a discrete and characteristic low temperature decrepitation event.
The failure to recognise this effect in previous decrepitation
studies has led to incorrect estimates of homogenisation temperatures
and discreditation of the method. But by understanding why these gas
rich inclusions decrepitate at low temperature it is clear that some
of the past criticisms of the method were unwarranted
and that we can actually take advantage of this low temperature
decrepitation as an exploration method to map out areas of gas-rich
fluids in hydrothermal systems without having to resort to more
tedious microscopic examination.
The
mines in the Shandong and Hebei provinces have no low temperature
decrepitation (except Hougou) which is in contrast with orogenicdeposits in Australia and Canada (Fig. 5).
It is inferred that these deposits either formed from fluids which
lacked CO2
or under low pressure conditions (less than 600 bars), as low
pressure inclusions may not be detected by decrepitation. Existing
work in Hebei does not indicate that the depositional environment was
of low pressure (Mao et al., 2003) and consequently these deposits
must have formed from fluids which were predominantly devoid of CO2.
The CO2
rich fluids found in previous research are probably a minor phase of
the overall hydrothermal systems and their relevance to the Au
mineralisation events needs to be re-considered.
Because
the decrepitation method uses 0.5 grams of crushed sieved
grains derived from a specimen of about 50-200 grams of quartz and
each analysis is the result of the decrepitation of up to hundreds of
thousands of individual primary inclusions, the result is highly
representative of the overall hydrothermal system. In addition, it is
very easy to analyse many samples to further improve the
representation of the system. In contrast, microthermometric
examinations must concentrate on a few tens of individual inclusions
from a few thin sections and can easily suffer from unintentional
bias in sample selection and fail to be representative of the overall
hydrothermal system, despite the great accuracy of the few
measurements obtained.
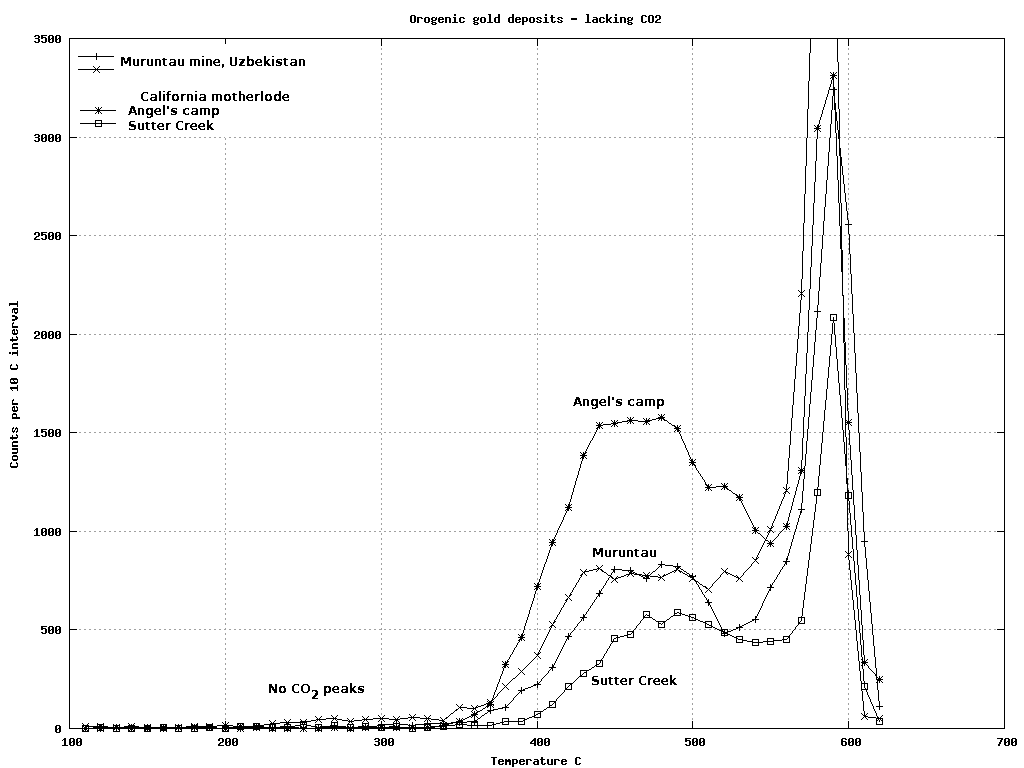
Fig.
9 Decrepitation results from other orogenic Au deposits at Muruntau,
Uzbekistan and the Motherlode, California, USA. These deposits also
lack low temperature decrepitation and CO2
rich fluids.
It
is of interest that decrepitation analyses data from the Muruntau,
Uzbekistan and California motherlode, USA deposits (Fig. 9) also lack
a low temperature decrepitation peak, from which it is inferred that
these systems were also formed from CO2
deficient fluids. This suggests the need to sub-divide the orogenic
gold deposits classification into those formed from CO2
rich and CO2
deficient fluids. There is an important difference between these
deposits and the so-called orogenic deposits in greenstones in
Western Australia and Canada (which formed from CO2
rich fluids) which should not be ignored.
6 Conclusions
The
acoustic decrepitation method is a useful
technique to rapidly determine the presence of gas-rich fluids in
inclusions. This is very useful as an exploration procedure as many
Au deposits are known to be associated with CO2
rich fluids. Although decrepitation has limitations in its accuracy,
it has a major advantage in its better representation of a
hydrothermal system. The complexity of microthermometric studies of
fluid inclusions together with the lack of specificity of the data
provided has prevented the application of fluid inclusions as an
exploration technique. Acoustic decrepitation overcomes these
problems and despite its lesser accuracy, provides a means of
applying fluid inclusions as an exploration method to find new
deposits rather than limiting their use to research on ore genesis
after the deposit has already been found.
References
Bodnar,
R.J., Binns, P.R. and Hall, D.L., 1989. Synthetic fluid inclusions –
VI. Quantitative evaluation of the decrepitation behaviour of fluid
inclusions in quartz at one atmosphere confining pressure. J.
metamorphic Geol. 7: 229-242.
Burlinson,
K., 1984. Exploration for gold at Pine creek and Tennant
Creek, N.T. and at Halls Creek, W.A. using the fluid inclusion
decrepitation technique. Aus.I.M.M. Conference, Darwin, N.N.
August 1984. (abstract only)
Burlinson,
K., 1988. An instrument for fluid inclusion decrepitometry
and examples of its application. Bull. Mineral.
111: 267-278.
Burlinson,
K., 1991. Decrepitation in gold exploration. A case history from the
Cotan prospect, N.T. J. Geochem. Exploration. 42: 143-156.
Feng-Jun
Nie, 1998. Geology and origin of the Dongping alkalic-type
gold deposit, northern Hebei province, people's Republic of China.
Resource Geology 48: 139-158.
Garba,
I. and Arkande, S.O., 1992. The origin and significance of
non-aqueous CO2
fluid inclusions in the auriferous veins of Bin Yauri, north-western
Nigeria. Mineralium Deposita 27: 249-255.
Goldfarb,
Richard J., Leach, David L., Rose, Scott C. and Landis, Gary
P., 1988. Fluid inclusion geochemistry of gold-bearing quartz veins
of the Juneau gold belt, South-eastern
Alaska: Implications for ore genesis. Econ. Geol mono. 6. The
geology of gold deposits: the perspective in 1988. 363-375.
Groves,
D.I., Barley, Mark E. and Ho, Susan E., 1988. Nature, genesis and
tectonic setting of mesothermal gold
mineralization in the Yilgarn block,
Western Australia. Econ. Geol mono. 6. The geology of gold
deposits: the perspective in 1988. 71-85.
Hladky,
G., 1983. Personal Communication.
Holloway,
J.R., 1981. Compositions and volumes of supercritical fluids in the
earth's crust. Min. Assoc. Canada short course Vol. 6. Fluid
inclusions: Applications to Petrology 13-38.
Leroy,
Jacques, 1979. Contribution a l'etalonnage de la pression interne des
inclusions fluides lors de leur decrepitation. Bull. Mineral.
102: 584-593.
Lowenstern,
Jacob B., 2001. Carbon dioxide in magmas and implications for
hydrothermal systems. Mineralium Deposita 36: 490-502.
Mao,
Jingwen., Li, Yinqing., Goldfarb, Richard., He, Ying. and Zaw, Khin,
2003. Fluid inclusion and noble gas studies of the Dongping gold
deposit, Hebei province, China: A mantle
connection for mineralization? Econ. Geol. 98: 517-534.
Mavrogenes,
J.A., Bodnar, R.J., Graney, J.R., McQueen,
K.G. and Burlinson, Kingsley, 1995. Comparison of decrepitation,
microthermometric and compositional characteristics of fluid
inclusions in barren and auriferous mesothermal quartz veins of the
Cowra Creek gold district, New South Wales, Australia. J. Geochem.
Exploration. 54: 167-175.
Naden,
J. and Shepherd, T.J., 1989. Role of methane and carbon dioxide in
gold deposition. Nature 342: 793-795.
Partamies,
S.A.G. and Poutiainen, M.A.J., 2001. Application of acoustic
fluid inclusion decrepitometry to gold exploration in Finland.
Geochemistry: Expl. Env. Anal. 1, 109-118.
Phillips,
G.N. and Evans, K.A., 2004. Role of CO2
in the formation of gold deposits. Nature
429: 860-863.
Qiu,
Yumin., Groves, David I., McNaughton, Neal J., Wang, Liang-gen and
Zhou, Taihe., 2002. Nature, age and tectonic setting of
granitoid-hosted, orogenic gold deposits of
the Jiaodong peninsula, eastern North China craton,
China. Mineralium Deposita
37: 283-305.
Redlich,
O. and Kwong, J.N.S., 1949. On the thermodynamics of solutions. An
equation of state. Fugacities of gaseous solutions. Chem. Rev.
44: 233-244.
de
Santis, R., Breedveld, G.J.F. and Prausnitz, J.M., 1974.
Thermodynamic properties of aqueous gas mixtures at advanced
pressures. Ind. Eng. Chem. Process Des. Dev. 13: 374-377.
Smith,
Ted J. and Kesler, Stephen E., 1985. Relation of fluid inclusion
geochemistry to wallrock alteration and lithogeochemicalzonation at the Hollinger-McIntyre gold
deposit, Timmins, Ontario, Canada. CIM Bulletin 78: 35-46.
About
the Author
Kingsley
Burlinson has worked in the exploration industry for 35 years and is
a consultant in Darwin, Australia.
 Applied Mineral Exploration