Newest
Topics:
For the latest news, see the NEWEST TOPICS page.
Google is too dumb to let me put the list of news in this column and falsely claims that all my pages are self-duplicates.
Google-NONSENSE
Google's so-called "Artificial Intelligence" is an abuse of the concept of intelligence!
How many and which fluid inclusions in
a sample actually decrepitate on heating?
Overview
A decrepitation analysis usually uses
0.5 gm of sample, in which there
can be in excess of 30 million fluid inclusions larger than 10 microns
across and far more inclusions of smaller size. Generally, in quartz,
most inclusions smaller than 10 microns across will not decrepitate.
And measurements of decrepitation show that only about 0.5% of the
inclusions larger than 10 microns across lead to counts in the
baro-acoustic decrepitation instrument. However, this still results in
100,000 or more decrepitation counts per sample, providing a
statistically meaningful measurement of the fluid inclusions in a
sample using this method. The inclusions which do decrepitate are
the larger ones and those containing CO2, or those of
irregular shape and perhaps only those near grain surfaces or planes of
weakness in the
host mineral.
Decrepitation
measurements are
currently the most effective way to understand a mineral-deposit scale
hydrothermal system in a manner which aids in its exploration and
further development.
Discussion
Since the earliest use of the decrepitation method it has been apparent
that not all fluid inclusions decrepitate when the sample is heated
well beyond the probable formation temperature of the sample. In
addition there have been questions about the relationship between the
decrepitation temperature (TD) , and the formation
temperature (TF) of the sample. Additional confusion arises
from the fact that we cannot actually measure the TF and
always measure the homogenisation temperature (TH) instead.
The TH
is the temperature at which all the separate phases visible in a
specific fluid inclusion merge into a single homogeneous phase. (Almost
all hydrothermal minerals form from what was originally a homogeneous
single phase fluid, which only separated into multiple phases as the
fluids in the inclusions later cooled down to room temperature.) Using
our understanding of the phase behaviour of multi-component fluids, it
is possible to derive the TF from our observations of TH.
However, the relationship between TD and TF
is far more complex as it also depends on the inclusion size,
composition and
morphology and the crystal structure of the host mineral. This
complexity led research workers to favour the microthermometric
measurement of individual fluid inclusion TH, rather than
use the decrepitation method. To obtain highly accurate temperatures,
measurements of TH are indeed preferable to
measurement of TD,
although such measurements require polished thin sections, are slow
and tedious and are prone to problems in extrapolating from one fluid
inclusion measurement to the scale of an ore deposit. However, because
decrepitation measures a great number of inclusions very quickly, it
provides a statistically meaningful result quickly and at low cost,
which is ideal for mineral exploration applications. But we need to
understand the decrepitation of fluid inclusions to understand how best
to interpret the data.
Some studies have been conducted to try and determine what internal
pressure is required within a fluid inclusion in order for it to
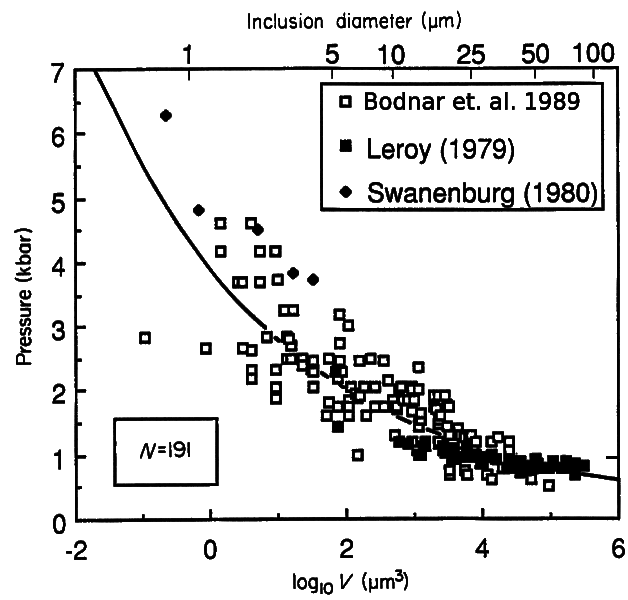
overcome the strength of the host quartz crystal and decrepitate. Leroy
(1979) determined that the pressure required to cause decrepitation
was
highly dependent upon the size of the inclusions. He found that
inclusions larger than 35 microns across would decrepitate at internal
pressures of 800 - 900 bars, which he says agreed with previous work by
Naumov et. al.. He also determined that smaller inclusions down to 12
microns across required up to 1200 bars of internal pressure to
decrepitate and that even smaller inclusions do not decrepitate even
with 2700 bars of internal pressure. Bodnar et.
al. (1989) examined the
decrepitation of pure aqueous synthetic inclusions in quartz and
derived an equation for the relationship between inclusion size and the
pressure required to cause decrepitation. This data was in agreement
with Leroy's work for large inclusions and showed that pressures up to 5000
bars were required to decrepitate inclusions as small as 2 microns across.
This data is shown in the following graph, showing 191 sample
measurements.
To better understand decrepitation behaviour, 4 samples were studied in
thin section to estimate the abundance of fluid inclusions and compared
with the observed decrepigram results. In each thin section, about 20
randomly chosen locations were selected, using 600x magnification (40
x15). At each location the number of inclusions of various sizes in a
50 micron square area was counted. The depth of field of view was
measured to be 5 microns, so each counted area was a volume of 12.5 x
10 -6 cubic mm. No attempt was made to distinguish between
primary and secondary inclusions and all visible inclusions were
counted.
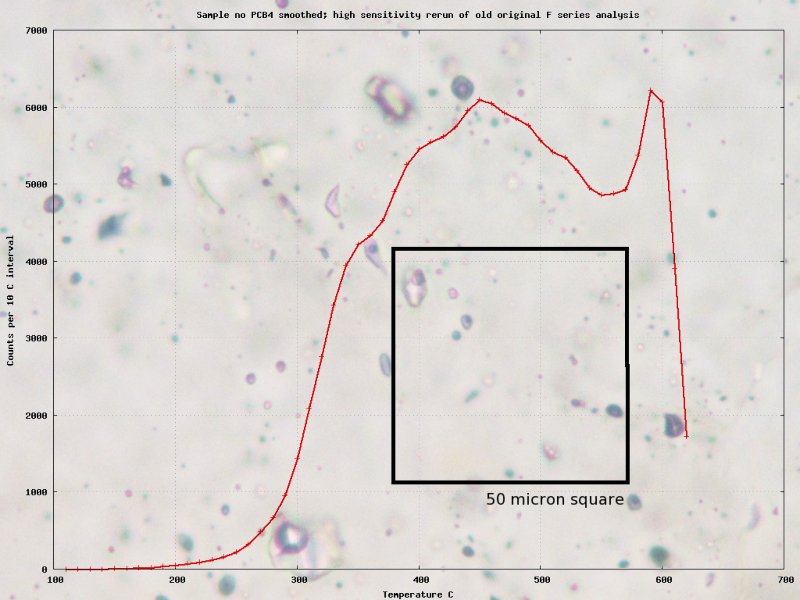
Sample PCB4 contains CO2 rich fluid inclusions, based on the
decrepitation curve having significant decrepitation below 300 C,
although such inclusions are not immediately apparent in the
photomicrographic view shown here. The 50 micron square counting area
is also shown. The decrepitation analysis result is shown by the red
curve.
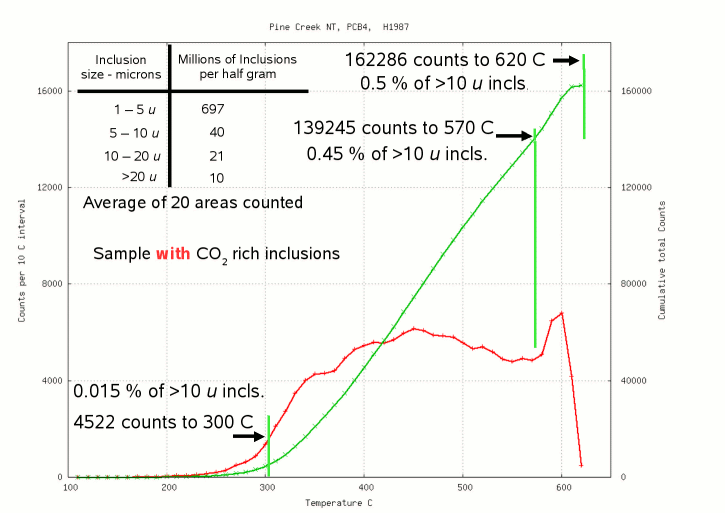
For sample PCB4, the graph in green shows the cumulative total of
decrepitation counts with increasing temperature, there being a total
of 162,286 decrepitation events recorded in this analysis. The visual
count of fluid inclusions showed a total of some 770 million inclusions
per half gram of quartz, but the great majority of these are smaller
than 5 microns across. If we assume that only inclusions larger then 10
microns across are able to decrepitate during heating, then the
measured decrepitation counts suggests that only about 0.5% of those
larger inclusions actually decrepitated and were counted in the
analysis. Details of the inclusion counts of this sample and the implications are here.
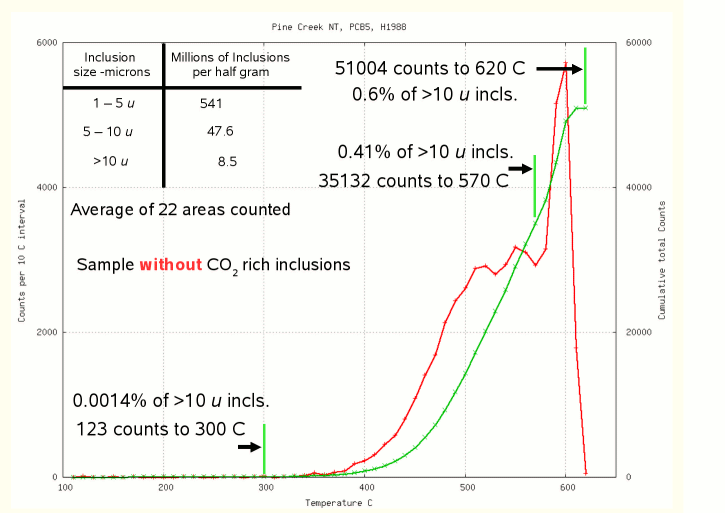
Sample PCB5 lacked any significant content of CO2 rich fluid
inclusions, shown by the very low counts of only 123 up to 300 C. The
total decrepitation counts up to 620 C is about 0.6% of the number of
inclusions larger than 10 microns present in the sample.
Although fluid inclusions are very abundant in these, and most quartz
samples, only a very low percentage of them decrepitate when heated
beyond their original formation temperatures. For small inclusions, the
quartz host mineral is strong enough to prevent decrepitation even
though there may be quite high internal pressures of about 5000 bars.
Most of the larger inclusions will also not decrepitate, so long as
they do not contain significant amounts of CO2, CH4
or other gases. (Such gas content of fluid inclusions has been shown here to be a major cause of decrepitation
because of the high internal pressures generated in inclusions with
significant gas contents.) So there are factors other than inclusion
size and
composition which must be strongly affecting the decrepitation
probability of an inclusion. The inclusion morphology is one of these
factors, as there would be a stress concentration at the points of
irregularly shaped inclusions. Inclusions of highly irregular shape are
frequently observed for CO2 rich fluid inclusions. Another
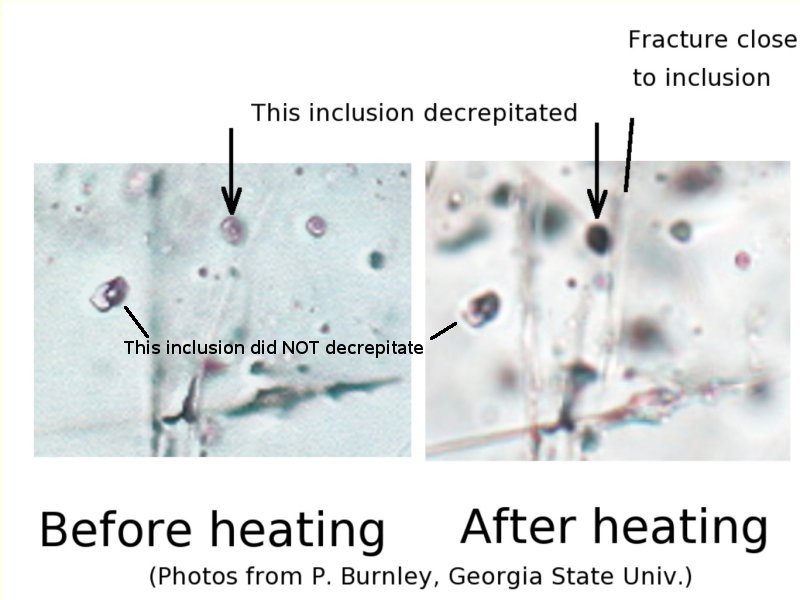
significant factor affecting decrepitation probability is the location
of the inclusion with respect to a grain surface or zone of weakness
within the quartz. This effect can be seen in the microphotographs
below which show the same quartz before and after heating. A small
inclusion decrepitated, because it was close to a visible fracture
plane, while a nearby larger inclusion did not decrepitate as it was
not near a zone of weakness in the quartz.
Summary
The relationship between measured TD and TH or TF
is complex and TD measurements can probably only give
approximate estimates of TF.
TD depends strongly on the size of the fluid inclusion and
its
morphology, but is even more dependent on the gas composition of the
inclusion. It also depends on the location of inclusions with respect
to weakness zones in the host mineral. And many inclusions will not
develop enough internal pressure when heated to overcome the strength
of the host mineral and will not decrepitate at all.
However, decrepitation has several major advantages in studying fluid
inclusions. It measures a large quantity of inclusions - frequently
hundreds of thousands, very quickly in just half an hour and without
the need for slow and expensive doubly-polished thin section
preparation. Because it measures so many inclusions, it is a better
estimator of the fluid conditions in the whole sample. Although this
does sacrifice some detail about microscopically sized zonation within
the sample, it is otherwise necessary to extrapolate individual fluid
inclusion measurements up to the scale of a hand specimen, a procedure
which is potentially erroneous and prone to severe operator bias.
In an exploration context, measurement of TD is sufficient
to ascertain the presence of important gases within the fluid, such as
CO2, which is often a useful indicator of economic
mineralisation potential. TD information is also useful as a
comparison and discrimination method within a
suite of samples. In mineral exploration there is no point in measuring
TH to the nearest 0.1 C as is done in
microthermometric methods, as hydrothermal systems undergo wide
temperature variations both spatially and temporally. Measurements of
gold deposition event temperatures in many studies shows that gold
deposits over a very wide range of temperatures, from some 200 C to
over 600 C, and at varying salinities (though usually low). Making
highly accurate temperature measurements merely contributes to the
"noise" in a data set and it is best to focus on a measurement such as TD
which is
easy to make, objective and highly reproducible and which highlights
fluid variations for use in outlining anomalous
areas worthy of more detailed follow-up exploration.
Decrepitation
measurements are currently the most effective way to understand a
mineral-deposit scale hydrothermal system in a manner which aids in its
exploration and further development. Highly accurate microthermometric
data is not useful in mineral exploration because it merely measures
relatively meaningless tiny temperature differences in a hydrothermal
system in which there are very large natural temperature fluctuations.
Obsessive concentration on such micro-detail merely obfuscates the
important variations occurring at the deposit scale.
Glossary
TF Temperature of
formation. The original temperature at which the mineral (quartz)
was deposited from the hydrothermal fluid. This cannot be directly
measured in the laboratory and is derived from other measurements and
inferences about the original sample deposition environment.
TH Temperature of homogenisation. The
temperature at which the visible phases of a multi-phase (eg liquid
plus vapour) inclusion at low temperature merge into a single
homogeneous phase. It is usually necessary to measure this under a high
powered microscope using a heating stage and a doubly polished thin
section of the sample.
TD Temperature of decrepitation. The
temperature at which an inclusion develops so much internal pressure
that it exceeds the strength of the host mineral and bursts open,
releasing the inclusion contents. The resulting pressure pulse is
detected and measured in the baro-acoustic decrepitation method.
References
Bodnar, R.J., Binns, P.R. & Hall, D.L. (1989), Synthetic fluid
inclusions - VI. Quantitative evaluation of the decrepitation behaviour
of fluid inclusions in quartz at one atmosphere confining pressure. J. metamorphic Geol., 1989, 7, 229-242.
Leroy, Jacques (1979), Contribution a l'etalonnage de la pression
interne des inclusions fluides lors de leur decrepitation. Bull. mineral. 1979, 102, 584-593.