Newest
Topics:
For the latest news, see the NEWEST TOPICS page.
Google is too dumb to let me put the list of news in this column and falsely claims that all my pages are self-duplicates.
Google-NONSENSE
Google's so-called "Artificial Intelligence" is an abuse of the concept of intelligence!
THE FLUID INCLUSION TECHNIQUE
IN EXPLORATION FOR GOLD MINERALISATION
K.
BURLINSON
February 1982
BURLINSON GEOCHEMICAL SERVlCES PTY. LTD.
PREFACE - April 2013
This old report from 1982 was written
at a very early stage in the decrepitation research when an
understanding of the decrepitation response of gas-rich CO2
inclusions was only just being recognized and long before a
full appreciation of its significance in exploration for
gold. The current full understanding of the importance of CO2
rich inclusions is detailed elsewhere on
this website.
CONTENTS
Page #
Conclusions
Introduction
1
Literature survey
1) Temperature of formation
2
2)
Boiling
3
3)
Salinity
4
4) Carbon Dioxide
4
5) Fluid Chemistry
5
6) Gold Transport & Precipitation Mechanisms
5
7) Zonal Patterns
6
8) Vein Characterization
6
9) Literature Summary
7
Relevance of Decrepitation
analysis to Exploration
8
Decrepitation studies at
Australian gold deposits
9
References
11
CONCLUSIONS
A review of the literature on fluid inclusion (FI) studies at
gold deposits shows that there is no single temperature. salinity
or fluid condition which is universally characteristic of gold
mineralisation. However. although no systematic relation between
mineralisation and FI data can be discerned on a regional scale,
there is considerable evidence in both the western and Russian
literature that such relationships do occur on a local scale. The
Russian literature in particular shows many examples of the use of
FI decrepitation data to define aureoles both around deposits and
across entire mining districts.
FI data is used in exploration for deposits in Russia but has
received scant attention in the Western world. Hence. because of
the difficulty of accessing the Russian data, there is no
satisfactory documentation available tn the western world either
to support or discredit the usage of Fis as an exploration tool.
Some preliminary work towards filling this void has been
undertaken on several Australian gold mining areas.
This has given some surprising results in suggesting that at
least some (but not all) gold deposits show a characteristic
decrepigram not observed either on barren quartz or at deposits of
base metals.
While this preliminary work seems to substantiate the local
effects described in the literature, it also implies a regional
relationship between gold and FI decrepitation which has not
previously been documented.
It is concluded that the use of FIs and the decrepitation method
in particular, warrants more serious consideration as a tool for
gold exploration than it is currently being given.
INTRODUCTION
This discussion is specifically directed towards aspects of
fluid inclusion (FI) data considered to be of relevance to
exploration for gold deposits. A previous report (6) has explained
the general concept of FI techniques (particularly decrepitation)
and their application in exploration for a wide variety of ore
deposits including gold. The reader is referred either to that
report or to Roedder (32) for a general overview of FI techniques
and decrepitometry in exploration.
This application note includes both a literature survey of the
available data on FIs in gold deposits and some selected
decrepitation results from my own investigations on Australian
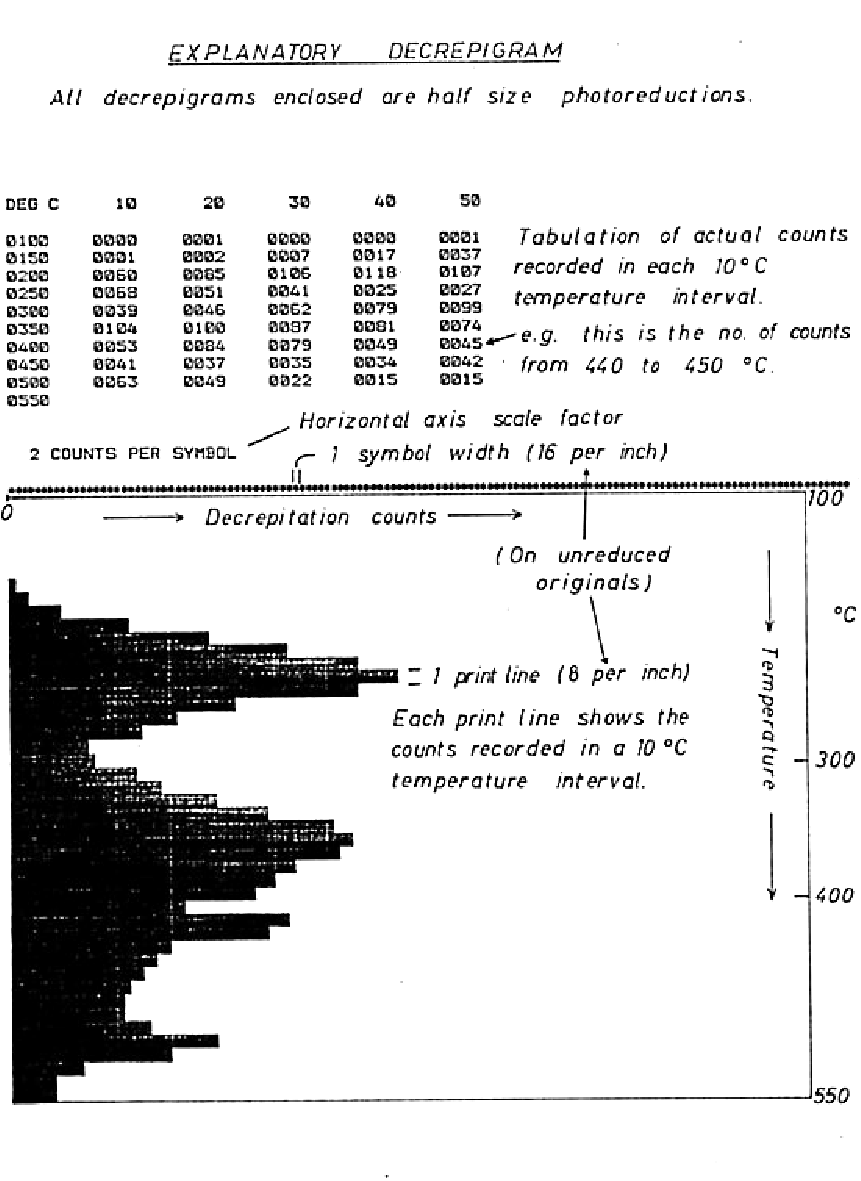
deposits during the past year. A number of decrepigrams are
enclosed and these have been printed on a less opaque paper so
that they may be overlain on a light table for relative
comparisons.
Gold deposits of many diverse origins including sedimentary,
volcanic hydrothermal, granitic hydrothermal. skarn and
metamorphic occur in a wide range of geological environments.
However the fluids involved are only rarely distinct between these
types and so I have subdivided this discussion on the basis of
fluid parameters rather than the mineralisation origin in order to
avoid undue repetition.
The conclusion is drawn that existing FI work has been strongly
biased toward the detailed study of individual deposits and that
there is a serious lack of data pertinent to exploration
situations. However this previous work does show the importance of
the characteristics of the ore forming fluid during the
mineralising process. Hence, by obtaining information on these
fluids by taking measurements on FIs it should be possible to
substantially improve the efficiency of gold exploration
procedures.
2
LITERATURE SURVEY
Temperature of formation
The homogenization temperature (Th) of inclusions within the
quartz gangue of many gold deposits has been determined in order
to define the temperature of deposit formation. The formation
temperature is derived from Th by making a correction for
pressure, which in the case of must gold deposits (being emplaced
at shallow depths) is only small (up to 30°C). The Russian
literature includes numerous determinations of decrepitation
temperature (TD) which is less directly related to the formation
temperature and in this section only the more reliable Th data is
discussed. The task of measuring the formation temperature is
complicated by the complex parageneses of most gold deposits. Up
to 7 stages of deposition are recognized in many deposits, these
being based on the occurrence of characteristic mineral
assemblages (quartz-adularia, quartz-carbonate, etc.). In general
only 1 or 2 of these stages carry gold in any single deposit and
it is necessary to determine the formation temperatures of each
stage in order to deduce the mineralisation history. Most authors
report that temperatures range from about 400 C to 200 °C over all
stages with occasional references being made to higher
temperatures of 500 °C or more in the mesothermal type deposits.
However the temperature range of formation of the gold mineralised
stages is typically much narrower and frequently the gold
deposition occurs only over a narrow temperature range of some 20
to 50 °C. (20, 24, 27). Despite this there is no general consensus
on the absolute temperature during gold deposition and this may be
anywhere from 200 to 350 °C in most deposits. Although each
mineralisation stage commonly shows a restricted range of
temperatures, adjacent stages generally overlap in temperature.
Some studies have shown a general decline in temperatures towards
the later mineralisation stages (11). but in general the
temperature remains fairly constant for all except the last stage
which is often of markedly lower temperature.
Overall there does not seem to he a regional relationship
between Au mineralisation and temperatures of formation for the
hydrothermal type deposits, as is concluded by Nash in his study
of 9 are deposits in Nevada (25). However within an individual
district a correlation between mineralisation and formation
temperature may occur and Nash (25) states that in such cases "the
temperature range (of mineralisation) is rather small".
The only deposit types which show a distinctly different
temperature pattern are the disseminated and stratabound types.
Data from the Carlin deposit shows that the likely temperature of
formation is 150° - 225°C (25,31), which is significantly
lower than the gold stages of typical hydrothermal deposits. Fripp
(11) proposes a formation temperature of 160° to 280 for
stratabound deposits in Rhodesia but no actual FI data seems to be
available to confirm this postulate.
Practically no data is available on the formation temperatures
of barren veins in the vicinity of gold mineralised veins and it
is impossible to say whether the two types could be distinguished
by temperature measurements.
3
Boiling
Numerous studies have found evidence of boiling in association
with gold mineralisation (31, 26, 29, 8, 16, 28). The gold
deposition usually accompanies such a boiling stage although
Casadevall et al (5) noted that boiling at the Sunnyside mine,
Colorado, occurred only in the last (Au barren) mineralisation
stage. Kamilli (16) presents a convincing case that the
gold-silver bonanza at the Finlandia Vein, Peru, is due to Au
precipitation accompanying boiling and suggests that many other
such bonanzas mined in the past may also have been due to local
boiling. The point is made that veins showing evidence of boiling
in present outcrops may contain concealed bonanza deposits at the
base of the zone of boiling.
However not all deposits show evidence of a boiling stage during
formation despite specific efforts in some cases to find such
evidence (25, 33). As no data on barren quartz veins in
mineralised areas is available it is impossible to say whether
evidence of boiling would be a useful exploration aid.
4
Salinity
Salinity measurements have been made on many deposits and in
most cases the ore fluids contain from 0.4% to 4% NaCl equivalent.
There do not seem to be any major systematic variations of
salinity between mineralisation stages although a weak trend
toward reducing salinity in later stages occurs at the Finlandia
vein, Peru (16). Nash (25, 27) notes that significant local
variations of salinity occur although these cannot be correlated
with mineralisation. He also proposes that fluid density (closely
related to salinity) could be used as an exploration guide in
Nevada based on the marked difference in salinity between porphyry
copper deposit fluids (frequently greater than 30% NaCl
equivalent) and the gold deposit fluids. However no data is
presented on the salinities of unmineralised veins to consolidate
this suggestion.
In the absence of data showing distinctive salinities or
salinity trends either through the various mineralisation stages
or spatially near the ore bodies, the measurement of FI salinity
does not seem to be of use as an aid to gold exploration.
Carbon Dioxide
The presence of CO2 rich inclusions has been noted in
a number of gold deposits including the Oriental (9) and Sunnyside
(7) mines in the U.S.A. and deposits in South America, Canada,
France and Russia (30, 4, 23). Machairas (23) has observed a
direct correlation between the presence of CO2 rich
inclusions and the occurrence of gold grades of 30 - 40
grams/tonne for South American, Canadian and French vein deposits.
However an inverse correlation between gold and CO2 has
been observed by Kalyuzhnyi et al at Chukotka, USSR, (15) who
conclude that the presence of CH4 and a low
concentration of CO2 are favourable gold indicators.
These contradictory results are probably due to different
mineralisation styles as CO2 could be expected in skarn
deposits or strongly metamorphosed areas (37). The occurrence or
absence of CO2 rich inclusions could be a useful
regional guide to gold mineralisation. Again there is a lack of
background data available on barren areas.
5
Fluid Chemistry
In this study I have not attempted an exhaustive survey of data
on the chemical composition of the fluids because of the
difficulty of applying such information in exploration. (Chemical
analyses of FIs require considerable effort because of the
exceptionally small quantities of fluid available.) However
practically all deposits have low chloride contents (salinities
less than 4% NaCl equivalent) with high Na/K ratios.
High concentrations of bicarbonate ions have been reported in
many Russian deposits (19,2). Although data presented by Anufreyev
et al (3) confirm these high bicarbonate levels compared with
various Sn, W and base metal deposits, bicarbonate levels in
barren veins were similar to those in mineralised veins!
Again. no clear pattern of relationship between fluid chemistry
and gold mineralisation is apparent. This would also seem to
indicate that the Au can be transported in complexes with various
anions in different situations.
Gold Transport and Precipitation Mechanisms
In accord with the wide range of deposit styles, temperatures
and fluid compositions reported for gold deposits there is a
similarly wide range of suggested transport and precipitation
mechanisms. Transport as chloride, sulphide or bisulphide
complexes is generally proposed but most work concentrates not on
the mode of transport but on the mechanism of precipitation.
Temperature changes, pressure changes, oxygen fugacity changes.
boiling, wall rock interactions, CO2 effervescence and
pH changes have all been proposed in roughly that order of
frequency. Some workers (14) invoke several mechanisms acting
together while others are able to distinguish a single principal
cause such as oxygen fugacity (13) or boiling (16). Obviously each
deposit needs to he considered separately and no overall
conclusion of immediate relevance to exploration methods can be
drawn.
6
Zonal Patterns
Very few studies have collected background samples or attempted
to sample outside or near the mineralised zone in order to test
for any zoning of FIs around the mineralisation centre. The
Russian literature is the best source of data on the development
of FI "aureoles" around mineralisation. Th zonation has been
observed at the Darasun deposit where palaeoisotherms concentric
to s porphyry intrusive have been plotted and both the horizontal
and vertical temperature gradients determined (22). Other workers
(10, 21, 1) have also shown the existence of Th zoning both around
individual gold deposits and across entire orefields and they have
used this information to determine the direction of ore fluid
movement, thereby inferring the ore source.
Boyle (5) conducted an extensive decrepitation survey in the
Yellowknife area, Canada, in an effort to define fluid flow
direction within the mineralised system but his results were
inconclusive. Unfortunately no samples were collected of nearby
barren veins for comparison with the mineralised veins.
Decrepitation measurements have been widely used in Russia to
outline TD and decrepitation activity zoning patterns around ore
deposits (1, 34, 18, 12).
Much of this work is only available to the western world as
abstracts in which actual maps of the zonation patterns are not
given, however contours of palaeoisotherms and profile plots of
decrepimetric activity over non-gold mineralisation are commonly
shown in translations of Russian papers. Several such plots are
shown by Roedder (32).
The observation of such zonal patterns seems to he of
considerable relevance in exploration for gold deposits.
Vein Characterization
The ability to distinguish between ore bearing and ore barren
quartz veins in the same district would be of great value in
exploration. Normal geochemical techniques are difficult to use in
this way due to the nugget effect of gold (which necessitates
unreasonably large samples for Au analyses) and the lack of
reliable geochemical pathfinder elements. At Murantau (36)
decrepigrams enabled the distinction of 3 genetic types of quartz,
one of which was mineralised. This was then used on a district
scale to identify the various quartz types. Konovalov (17) also
outlined differences between the gold bearing and barren veins in
the Lena goldfield and considered such differences to be of use as
an exploration tool. At the Aldan complex (35) mineralised quartz
was found to show a single peaked decrepigram whereas barren
quartz gave a bimodal decrepigram enabling ready distinction of
the mineralised veins. In my own work I have also been able to
distinguish mineralised from barren veins by using this technique
on deposits in the Pilbara and Yilgarn blocks in W.A. (discussed
fully later in this report). This method has also been of use on
some Australian Sn and Mo deposits and it is now being applied in
their exploration.
7
Literature Summary
The fluids associated with gold mineralisation are of quite
diverse character and do not exhibit any consistent temperatures,
salinities. chemical compositions or phase effects such as boiling
ON A REGIONAL SCALE. However temperatures and phase effects do
seem to show patterns related to mineralisation on a district
scale. Most FI studies done to date have focused on the
mineralised bodies themselves with very little attention to
determining the local backgrounds. Only the Russians have looked
at this aspect in detail.
Particular aspects of relevance in exploration are:-
The occurrence of boiling.
Possible temperature or decrepitation activity gradients
around individual deposits or across a mineralised district.
Characterization of veins into either potentially mineralised
or unmineralised by using decrepitation techniques.
In view of the gold potential of Australia and the importance
attached to FI determinations in investigation of gold deposits in
the USSR and the USA, the scarcity of published FI data on
Australian deposits is enigmatic.
8
Relevance of Decrepitation analyses to Gold Exploration.
Because the collection of FI data by conventional microscopic
methods is slow and expensive, decrepitation measurements are
considered to be the most promising means of using FIs to
advantage in exploration for gold. While decrepitation data is
relatively quick and inexpensive the technique does not produce
exactly equivalent data to the microscope methods. Decrepitation
temperatures are rather less reliable than homogenization
temperatures for estimating the deposit formation temperature. In
decrepitation work there is only a limited ability to distinguish
between primary and secondary inclusions and it is not possible to
obtain any information on the fluid chemistry. However
decrepitometry does give an indication of the abundances of
inclusions and by measuring a large number of inclusions a
statistically more meaningful result is obtained for each sample.
Despite these differences from the conventional microscopic
methods, decrepitation data is still applicable in exploration in
the following ways.
Palaeoisotherms of TD around individual ore bodies and across
orefields can be obtained. Within any given area, assuming
limited fluid composition changes and a constant host mineral
phase, contours of TD would delineate formation temperature
patterns although the absolute temperatures would not be
accurate. However palaeotemperature anomalies and gradient
directions could be defined.
Decrepimetric activity contours are easily produced and have
been shown to be useful in exploration in many areas in Russia.
It may be possible to detect boiling conditions, given some
microscope control data. This would be expected to give a very
broad decrepitation maximum due to the FI heterogeneity which
occurs under boiling conditions.
It is possible to characterize various vein stages and
systems and relate them to mineralisation on a local scale by
using their decrepitation signatures.
This technique is currently being exploited in exploration of
some Australian deposits.
9.
Decrepitation Studies at several Australian Gold Deposits
Over the past year Burlinson Geochemical Services Pty. Ltd. has
investigated a number of gold deposits in Australia using a micro-
processor controlled instrument especially constructed for the
purpose. This is one of only a very few decrepitometers outside
Russia and is thought to be the only computerized decrepitometer
in existence. With it, reliable results, completely free of
subjective effects can be obtained.
The work done to date has concentrated on distinguishing between
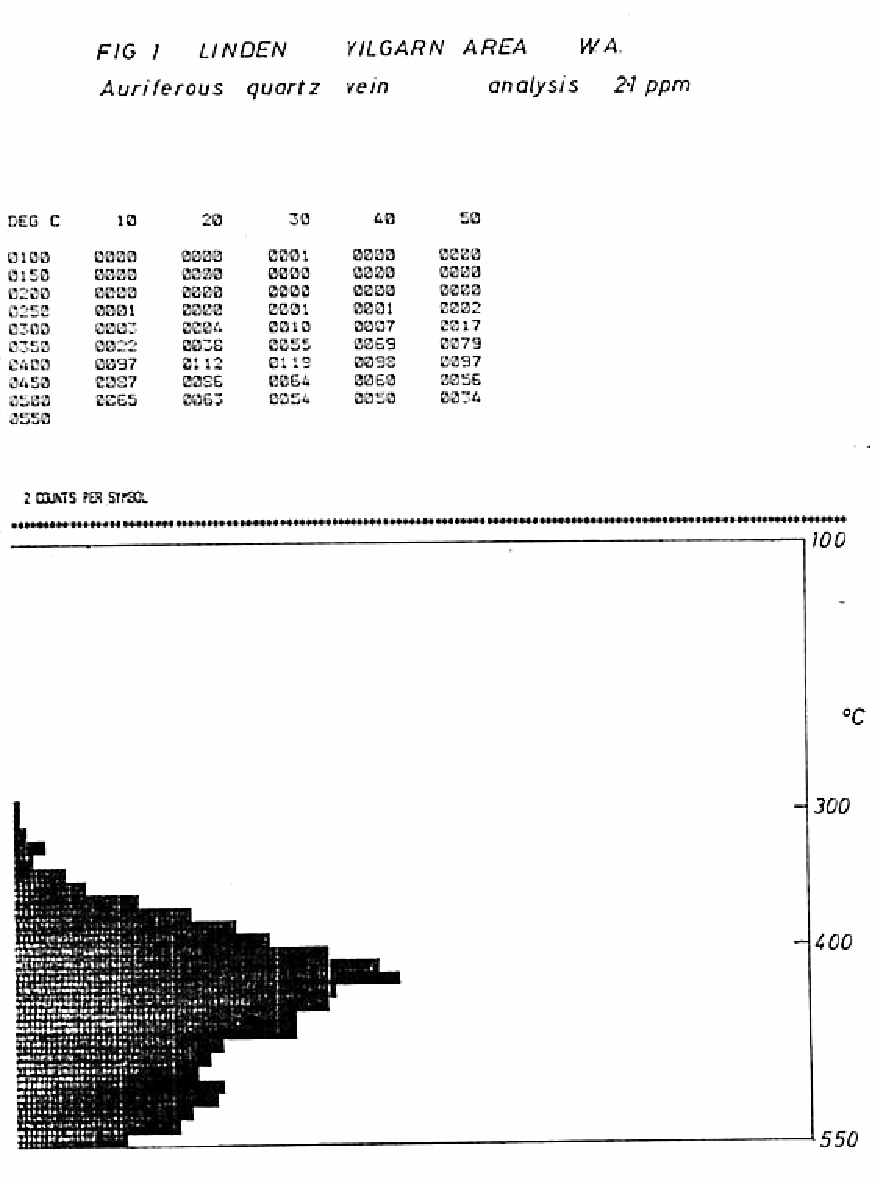
multiple generations of quartz veins. At the Linden area, 200km NE
of Kalgoorlie, W.A., 15 samples were collected for decrepitation
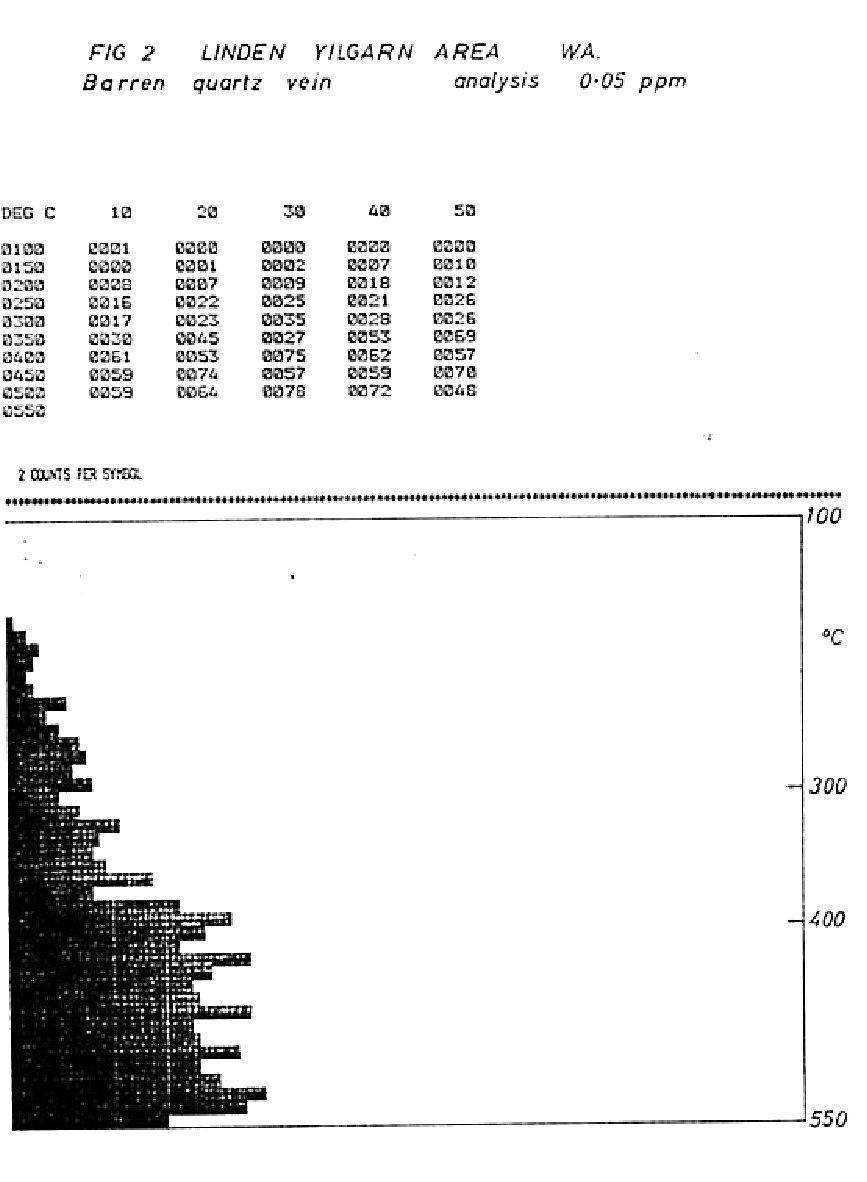
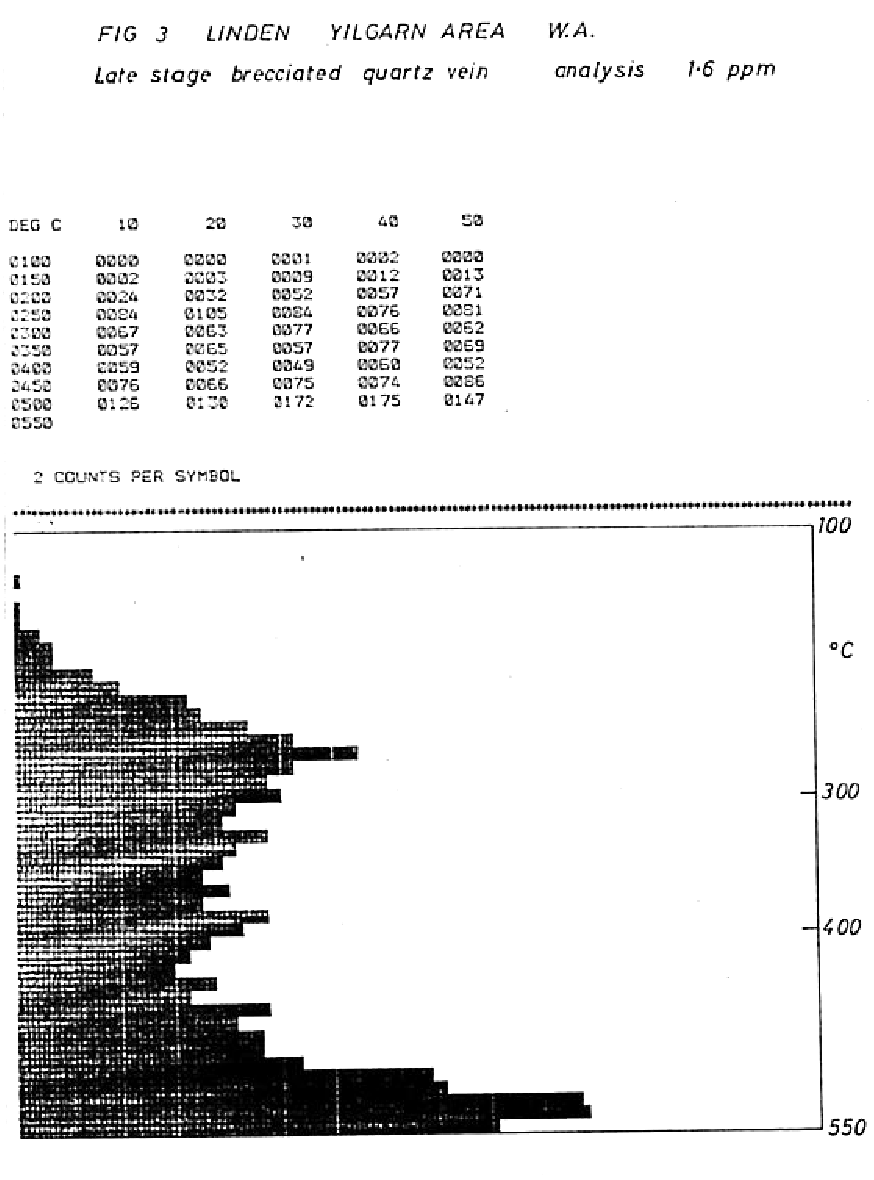
as well as chemical analyses. Figures 1, 2 and 3 show typical
results from 3 of the 4 different types of quartz veins in this
area. Most of the auriferous veins (5 samples) shew a moderate
activity decrepigram with a well defined peak (Figure 1), whereas
the barren veins show low activity without any distinct peaks
(Figure 2). A second type of auriferous quartz occurs in a
brecciated quartz vein and this shows a well developed low
temperature peak on the decrepigram (Figure 3). This survey
successfully distinguished the 2 auriferous quartz systems from
the barren quartz veins nearby.
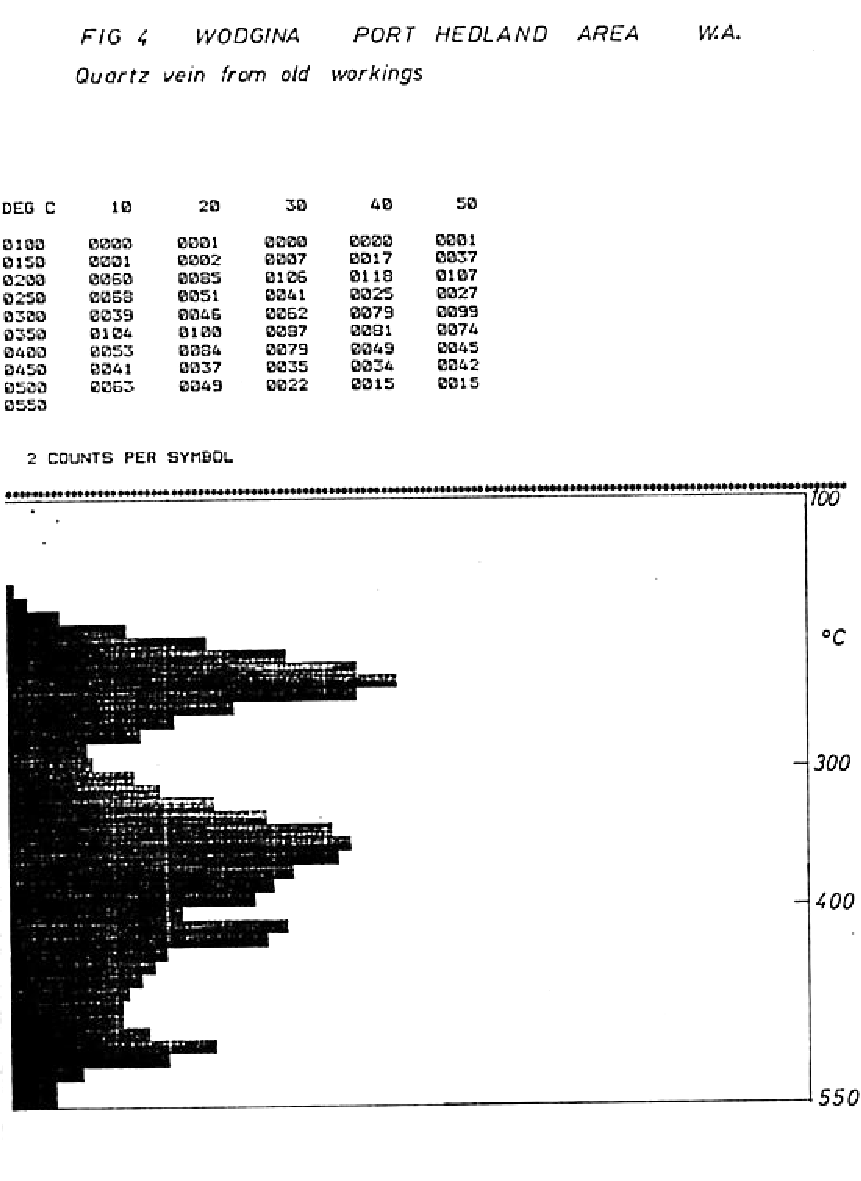
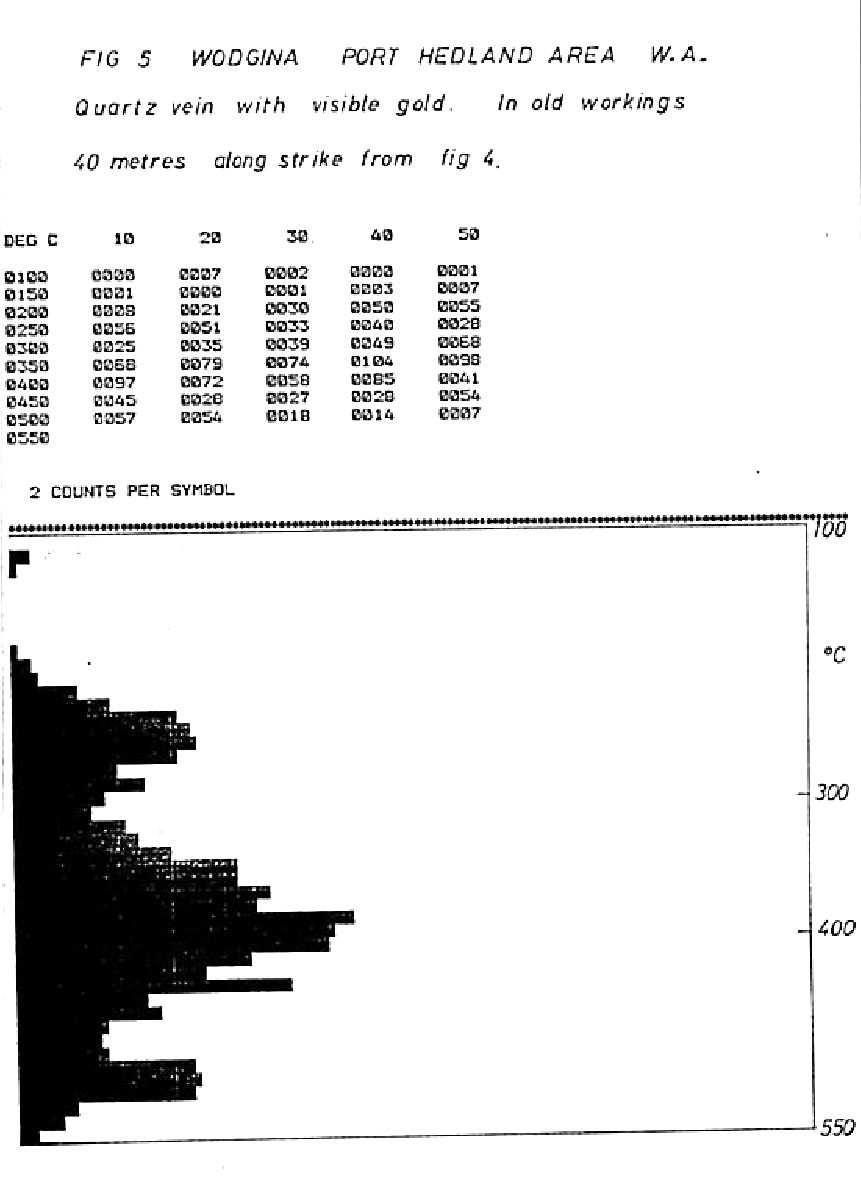
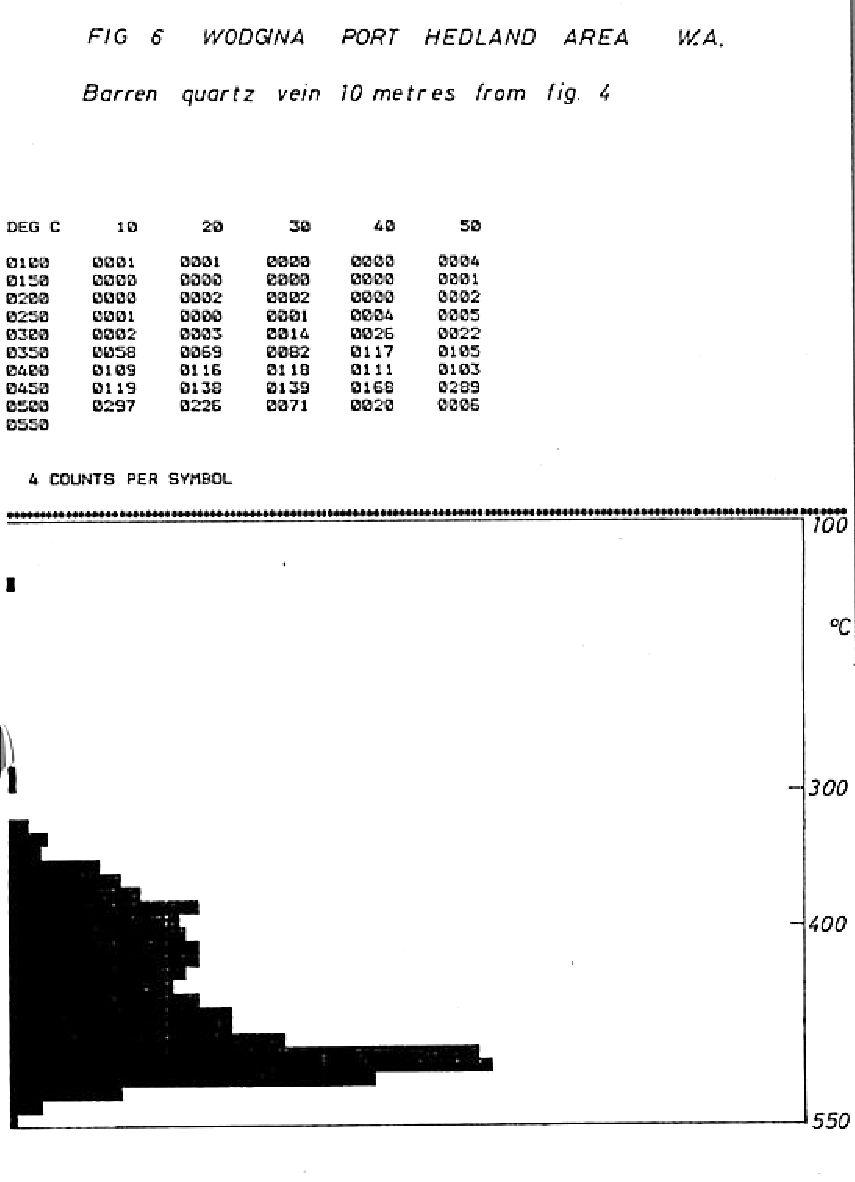
Another survey at a small. unnamed prospect east of Port
Hedland. W.A.. also successfully distinguished between auriferous
and barren quartz veins only 10m apart. Figures 4 and 5 are of
samples 40m apart in the auriferous quartz vein and show similar
decrepigrams with distinct low temperature peaks whereas a barren
quartz vein nearby completely lacks this peak {Figure 6).
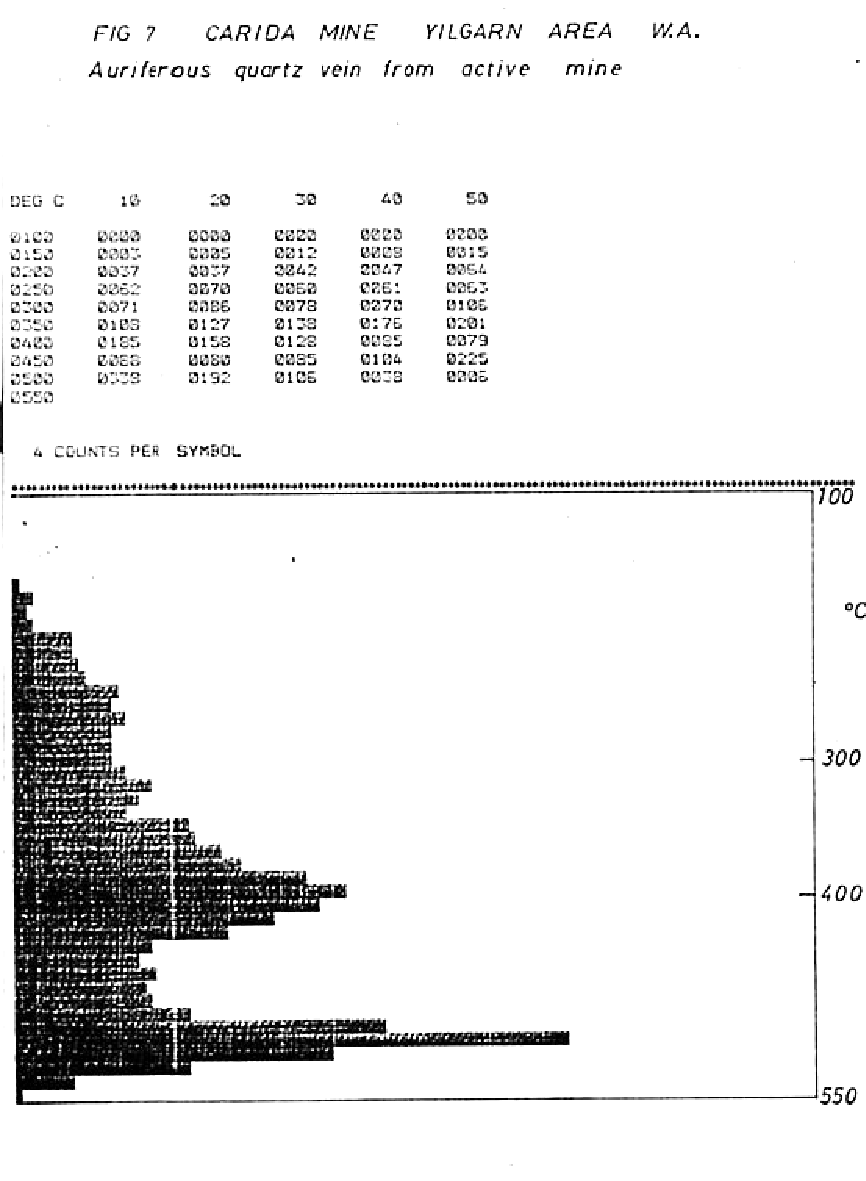
Several samples from the Carida mine in the Menzies-Sandstone
area, W.A.. also show a distinct low temperature decrepigram peak,
albeit of lower amplitude than either of the above areas (Figure
7).
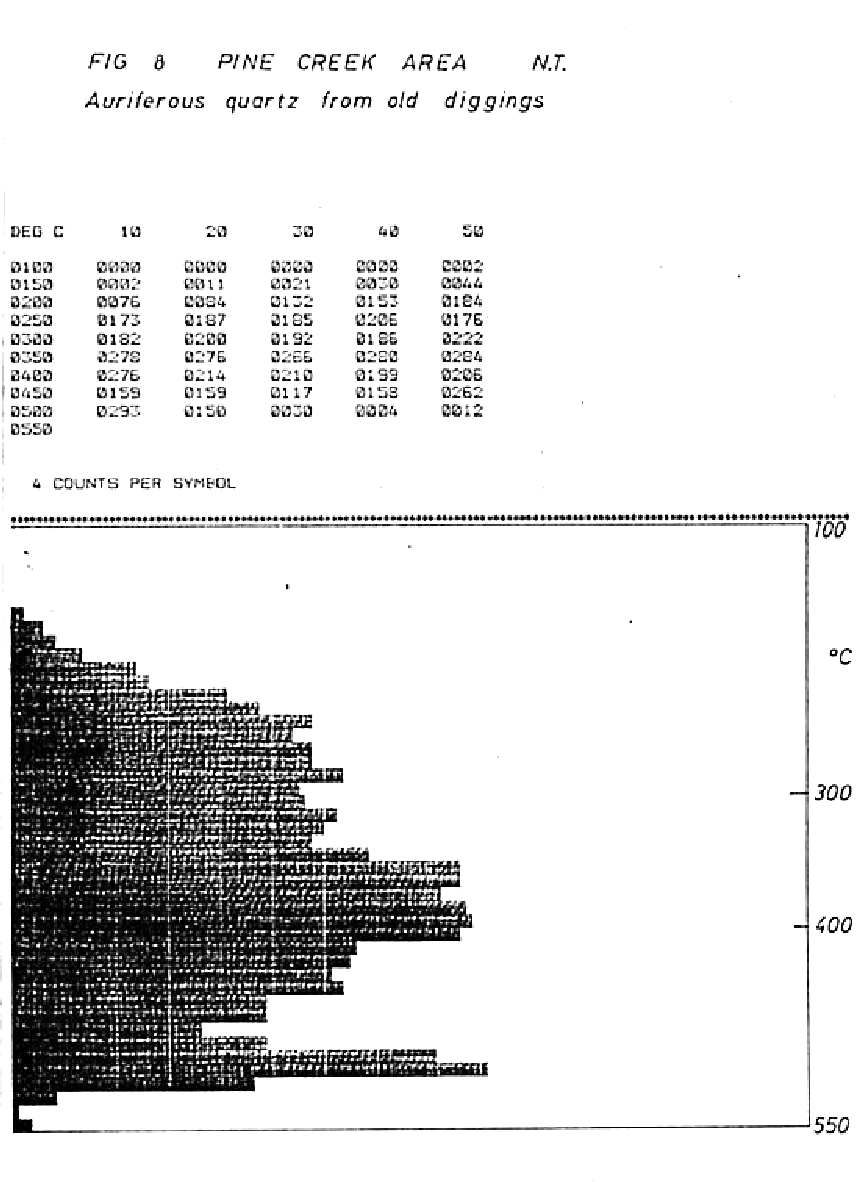
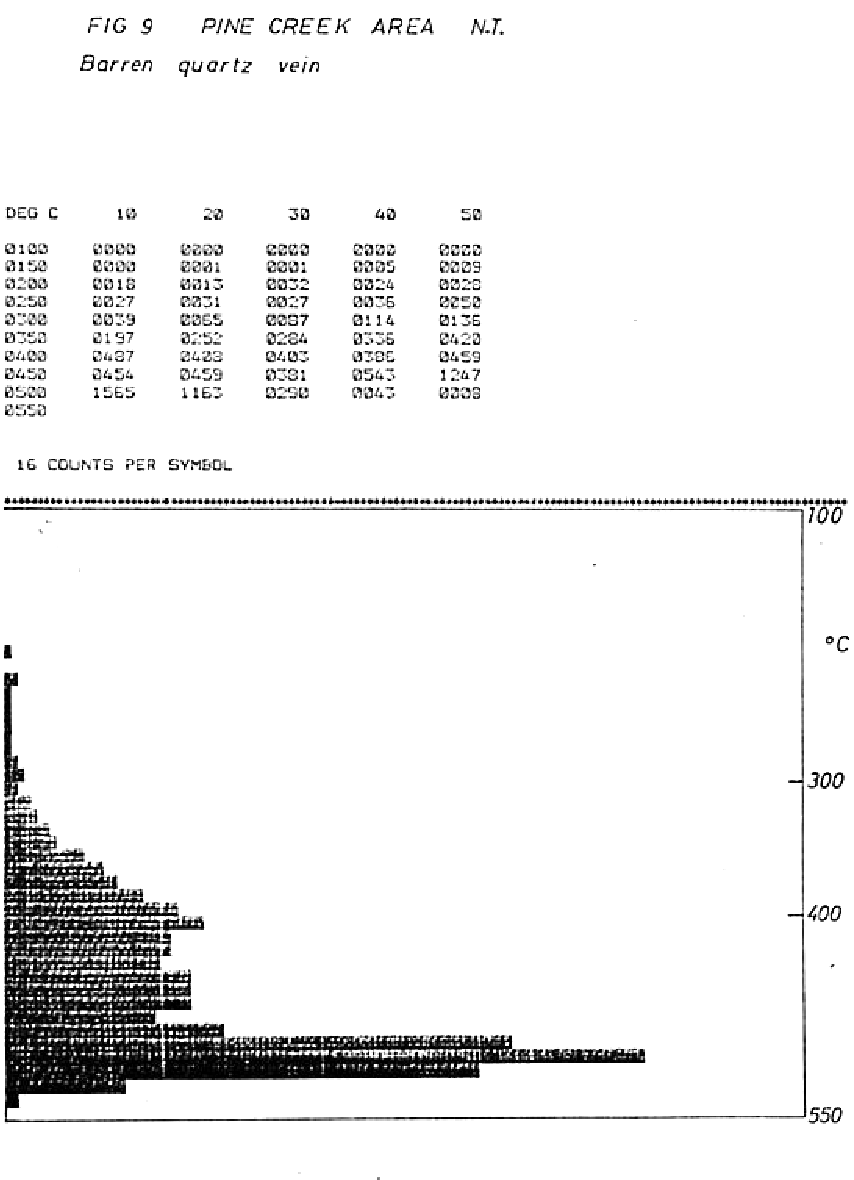
Samples of veins in the Pine Creek region, N.T., also show a
similar, distinct low temperature peak on auriferous veins (Figure
8), while barren veins lack such a feature (Figure 9).
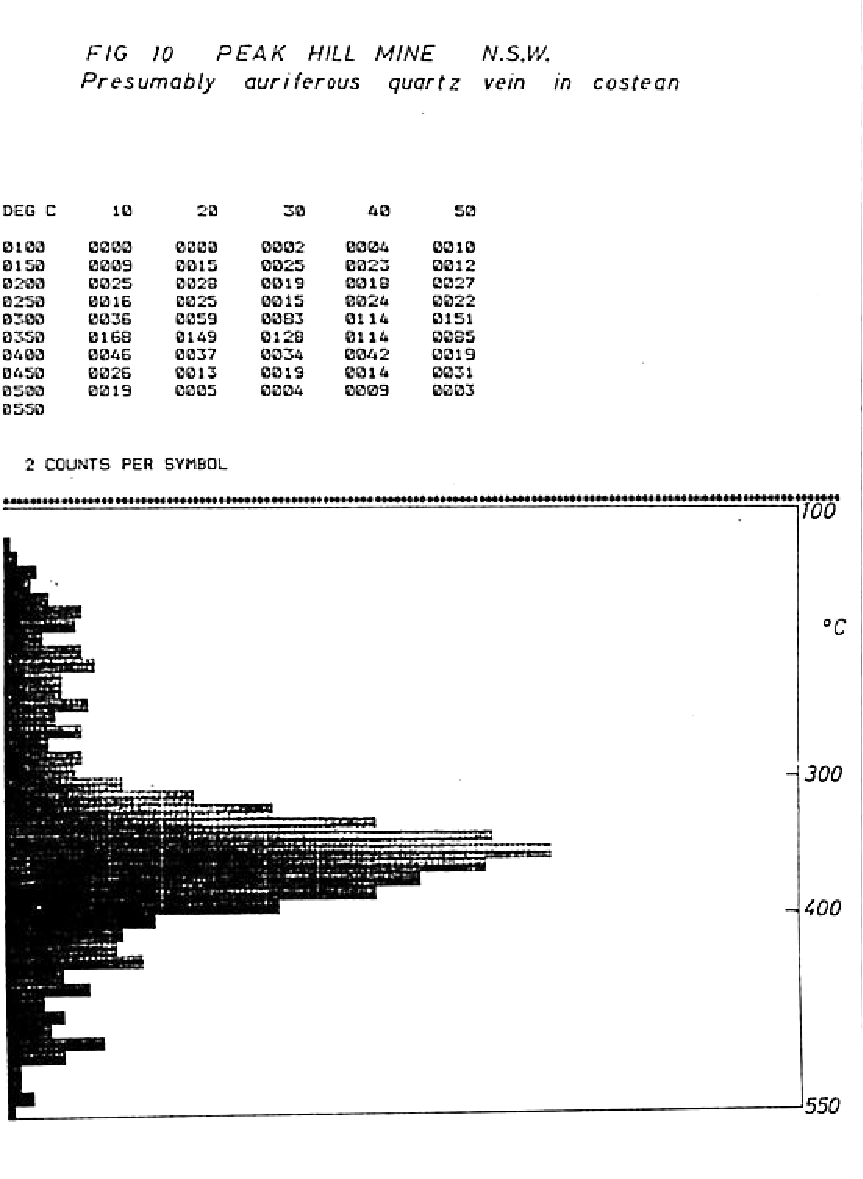
A sample from the Peak Hill mine, NSW, also showed some low
temperature decrepitation activity (Figure 10), although this was
much less prominent than seen elsewhere. No suitable barren vein
samples were collected at this locality for comparison.
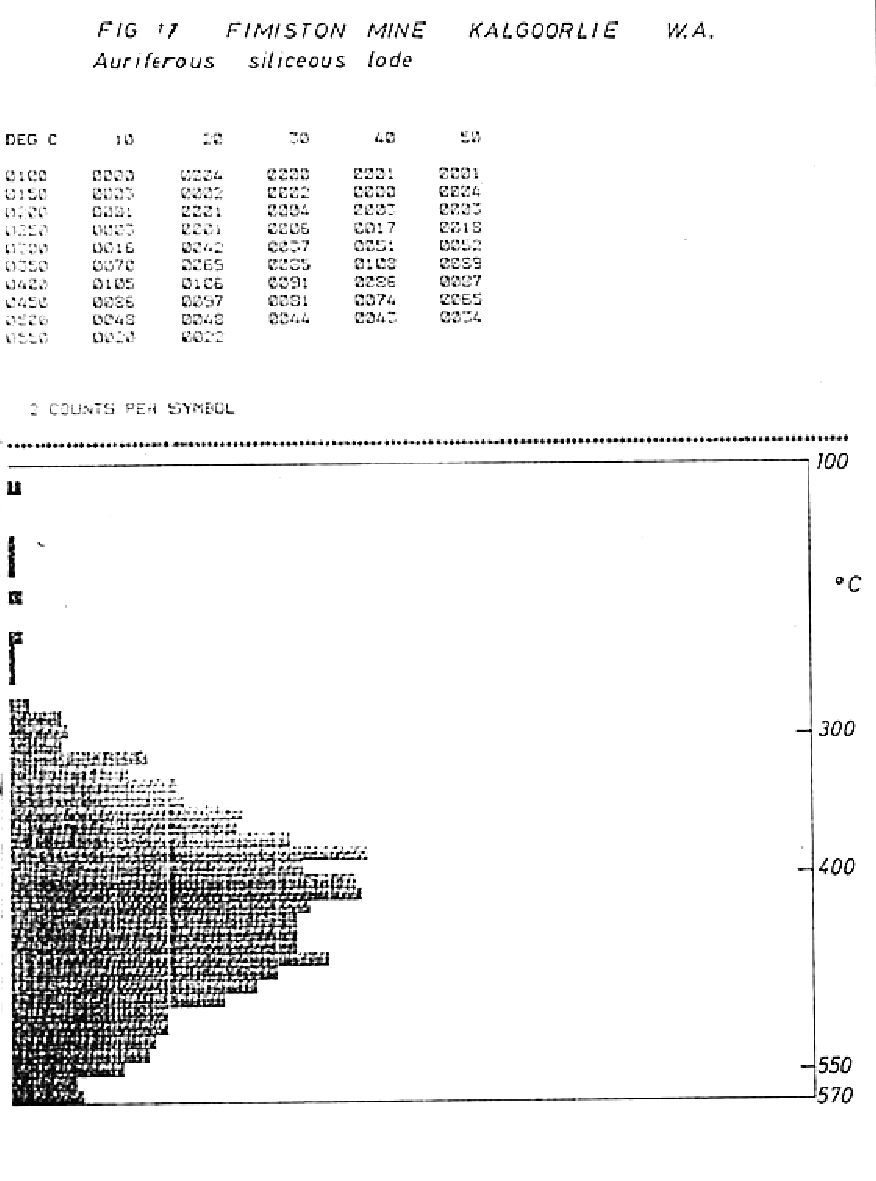
This low temperature feature on the decrepigrams does not occur
at all gold deposits. Some auriferous veins at Linden (above) and
auriferous "siliceous lode" material from the Fimiston mine,
Kalgoorlie, W.A., (Figure 11) do not show such a peak. However in
several hundred decrepigrams of other mineralisation types,
including tin, molybdenum and copper deposits, only rarely have
similar low temperature peaks been observed.
This curious apparent relationship between decrepigram shape and
some types of gold mineralisation is based on insufficient studies
to be convincing at present but is obviously worthy of further
investigation!
11
REFERENCES
NOTE: References to COFFI indicate an abstract in "Fluid
Inclusion Research - Proceedings of COFFI" Editor E. Roedder,
University or Michigan Press, Ann Arbor, USA.
l. Andrusenko N.I. 1973 Temperature zonation of gold-silver
deposits. Internat. Geol. Rev. V21 no.7 p815
2. Andrusenko N.I. & Shchepot'yev 1974 Temperature
conditions and stages of formation of subvolcanic gold-silver
deposits of central Kamchatka COFFI V7 p5, Geochem. Internat. VII
no 1, p130
3. Anufryev Yu. N, Moskalyuk A.A., Pokrovskii P.V. & Purtov
V.K., 1974 Mineral Forming solutions of hydrothermal deposits of
Ural. COFFI V7 p7
4. Boyer F., Touray J-C, Vogler M. 1967 Presence if liquid CO2
inclusions in quartz from the auriferous district of Salsigne.
COFFI V2 p31
5. Boyle R.W. 1954 A decrepitation study of quartz from
the Campbell and Negus_Rycon shear zone systems, Yellowknife,
Northwest Territories. Geol. Surv. Canada Bulletin 30
6. Burlinson K. 1980 Fluid inclusion procedures for exploration
- a literature survey. Burlinson Geochemical Services Pty.
Ltd.
7. Casadevall T., Ohmoto H. 1976 Sunnyside mine. Eureka mining
district, San Juan County, Colorado : Geochemistry of gold and
base metal ore formation in the volcanic environment. COFFI V8 p32
8. Casadevall T., Ohmoto H., Rye 1974 Sunnyside mine, San Juan
County Colorado: Results of mineralogic, Fluid inclusion and
stable isotope studies (abst.) Econ. Geol. V69 p1178
9. Coveney R.M. Jr. 1973 Fluid inclusion studies at the Oriental
Gold mine COFFI V6 p31
10. Davidenko N.M., 1973 Genetic classes and zoning of gold ore
deposits of mesozoic Chukotka folded belt (based an inclusions in
minerals) COFFI V7 p43
11. Fripp R.E.P. 1978 Stratabound gold deposits in archaean
banded iron formation, Rhodesia Econ. Geol. V71 p58
12. Goncharvo V.I., Sidorov A.A & Shapovalov 1973
Decrepitophonic survey as a method of determination of hidden
veins in the ore fields of volcanogenic regions. COFFI V7 p69
13. Hattori K. 1975 Geochemistry of ore deposition at the Yatani
lead-zinc and gold-silver deposit, Japan. Econ. Geol. V70 p677
14. Henley R.W., Norris R.J. & Paterson C.J. 1976 Multistage
ore genesis in the New Zealand geosyncline, a history of
post-metamorphic lode emplacement. COFFI V9 p56. Mineralium
Deposita V11 p180
15. Kaluzhnyi V.A., Davidenko N.M., Zinchuk I.N., Svoren'
I.M.& Pisotskiy B.I. 1975 Role of CO2-H2O
and CH4-H2O fluids in forming ores at
Chukotka COFFI V8 p82
16. Kamilli R.J., Ohmoto H. 1977 Paragenesis, zoning, fluid
inclusion and isotopic studies of the Finlandia Vein, Colqui
district, Central Peru Econ. Geol. V72 p950
17. Konavalov l.V. 1975 Temperature of formatonn of gold ore
deposits in the Leno Field as a function of metamorphic facies.
COFFI V8 p93
18. Korobeynikov A.F.& Matsyushevskiy A.V. 1973
Application of methods of mineral thermometry for prospecting and
evaluation of one necks in endogenic gold deposits. COFFI V6 p81
19. Korobeynikov A.F. & Matsyushevskdya L.B. 1973
Geochemical types of gold bearing hydrotherms from data on
gas-liquid inclusions in minerals. COFFI V6 p82
20. Lazko E.M., Doroshenko Y.P., Koltun L.I., Lyakhov Y.V., Myaz
N.I. & Piznyur A.V. 1971 Processes of hydrothermal
minerogenesis in the East Trans baikalain deposits / on gas-
liquid inclusions in the minerals COFFI V4 p40
22. Lyakhov Y.V. 1975 Temperature zoning of Darasun deposit.
COFFI V8 p110
23. Machairas G. 1970 the association of fluid inclusions and
gold particles in auriferous quartz. COFFI V3 p43
24. Naiborodin V.I. & Sidorov AA. 1973 Some properties of the
dynamics of the mineral forming process in volcanic Au-Ag
deposits. COFFI V7 p151
25. Nash J.T. 1972 Fluid Inclusion studies of some gold deposits
in Nevada. USGS Prof. Paper 800C pC15
26. Nash J.T. & Cunningham C.G. Jr. 1973 Fluid inclusion
studies of the Fluorspar and gold deposits. Jamestown district
Colorado. Econ. Geol. V68 p1247
27. Nash J.T. 1975 Fluid Inclusion studies of vein, pipe and
replacement deposits. Northwestern San Juan Mountains, Colorado.
Econ. Geol. V70 p1448
28. O'Neil .J.R. & Bailey G.B. 1979 Stable Isotope
investigation of gold bearing jasperoid in the Central Drum
Mountains, Utah. Econ. Geol. V74 p852
29. Petrovskaja N.V. & Vasiliev V.I. 1973 Evidence from
electron microscopy on gaseous inclusions in quartz from the Balei
deposit as an indication of the boiling of hydrothermal solutions.
COFFI V6 p123
30. Popivnyak I.V. 1975 Role of CO2 in forming of
deposits of Muyskiy gold ore region COFFI V8 p146
31. Radke A.S. & Dickson F.W. 1974 Controls on the vertical
position of fine grained replacement type gold deposits
COFFI V7 p177
32. Roedder E. 1977 Fluid inclusions as tools in mineral
exploration. Econ. Geol. V72 p503
34. Shevkalenko V.L. & Tsoi A.V. 1972 Use of the
decrepitogram of quartz for the study of zoning in gold-silver
deposits of Shkolnoe (northern Tadzhikstan) COFFI V5 p100
35. Shany G.K. & Levitskiy Y.F. 1976 Gold ore mineralisation
and metasomatic processes in alkaline rocks (exemplified by Aldan
complex) COFFI V9 p127
36. Veres G.I., Kasavchenko G.V. & Trankvillitskaya I.A.
1973 On evaluation of gold bearing features of quartz Fran
Muruntau by thermobarometric analysis. COFFI V6 p162
37. Wilkins R.W.T. 1977 Fluid inclusion assemblages of the
stratiform Broken Hill Ore deposit, NSW Science V198 p185
 Applied Mineral Exploration