Newest
Topics:
For the latest news, see the NEWEST TOPICS page.
Google is too dumb to let me put the list of news in this column and falsely claims that all my pages are self-duplicates.
Google-NONSENSE
Google's so-called "Artificial Intelligence" is an abuse of the concept of intelligence!
The BGS model 216 decrepitometer
Improved electronics - 2019, 2021
The new model 216 decrepitometer is physically similar to the model 205 decrepitometer and uses the
same furnace and operational computer and software but has updated
and improved electronics which gives higher sensitivity and more
convenient cable connections. As with the model 205, model 216
uses a standard single-board Linux computer running the Debian
Ubuntu operating system. The decrepitometer operation software has
a full graphical interface and operates in the X-windows
environment. The temperature and counts are monitored and shown on
screen during the analysis, and simultaneously plotted on screen
in a separate window as the temperature rises. The data is saved
to a file upon completion, and the graphical plot can also be
saved as an image file or printed if required and easily
regenerated from the saved data file for additional review.
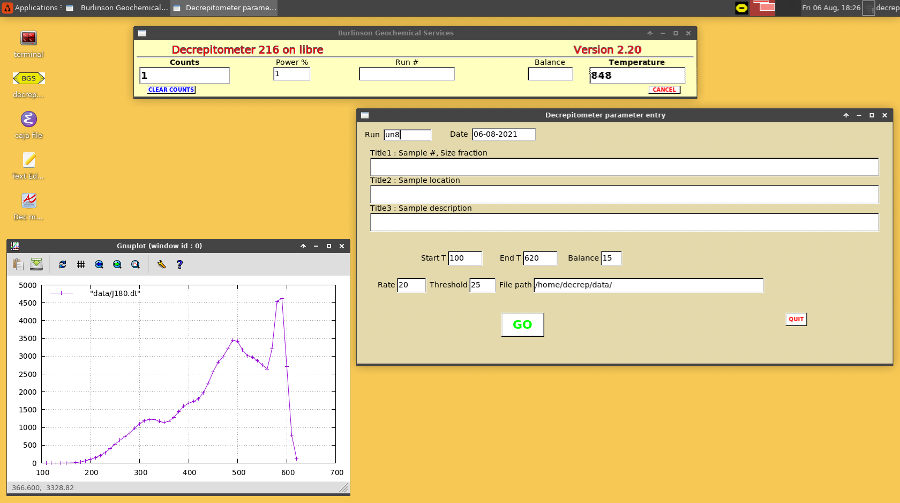
This is the screen for data entry and sample analysis.
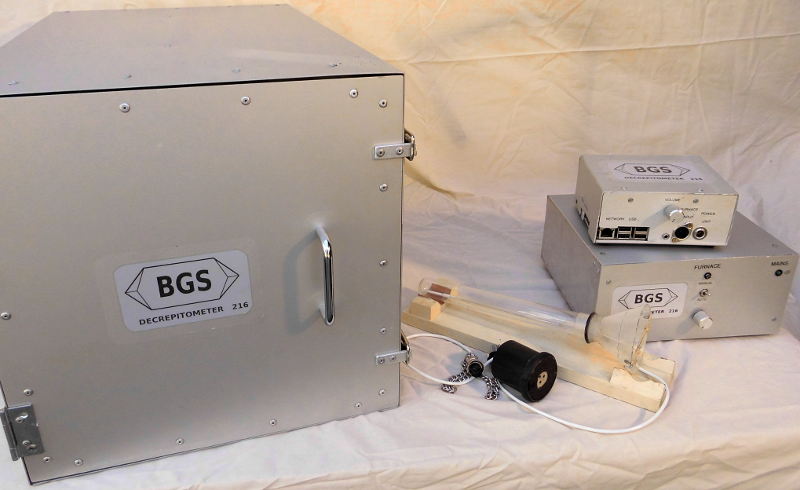
This is the complete model 216 instrument.
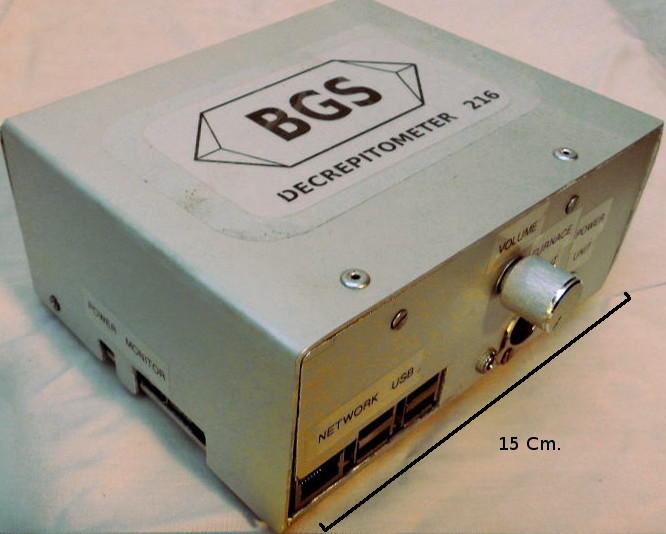
This is the main electronics unit incorporating the signal
processing and the computer.
As with the previous model 205, the
model 216 provides the complete computer as part of the instrument.
It can be operated stand-alone with the addition of a HDMI monitor,
and USB keyboard and mouse, or operated remotely across a network
using the included wired lan connector. The computer and its
interface electronics enclosure is 15 * 13 * 7 cm, the power supply
unit is 20 * 22 * 10 cm and the furnace enclosure is 33 * 33 * 60
cm.
Operation is the same as for the model 205 decrepitometer. The
weighed sample is added to the sample tube, the sensor is added,
it is inserted into the furnace, the plugs are connected and the
door of the enclosure is closed. The sample information and
control settings are entered into the control window and the "GO"
button is clicked. The analysis then commences and a plot window
shows a graph of the data as it is collected. The entire analysis
is completed automatically without further user intervention. At
the end temperature, the furnace is turned off and the control
window re-appears to allow analysis of additional samples. The
plot remains in view, with additional plot windows being created
for additional samples. It is necessary to allow the furnace to
cool before analysing subsequent samples. The saved data files
include the operation parameters and sample details as well as the
decrepitation count values. These files are plain text and can be
viewed or edited in any text editor software as well as used by
Gnuplot or other graph plotting software.
Samples of 0.5gm are normally used while samples as small as 0.2
gm or up to 2 gm can be analysed according to the fluid inclusion
abundance in the sample. The heating rate used is almost always
20ºC per minute, but the instrument can also be operated at 10ºC
or 40ºC per minute. Analyses are usually performed on quartz
samples, but other minerals containing fluid inclusions can also
be used, such as carbonates, feldspars and opaque minerals such as
haematite and magnetite. Sulphides can also be analysed, but they
can be corrosive and this reduces the life of the temperature
sensor. Quartz samples are usually analysed up to 620ºC because
there is no significant activity above the alpha to beta phase
transition at 573ºC, however the instrument can be used for
analyses up to 800ºC.
The system can be installed in a normal quiet laboratory location
as ambient sounds are suppressed. However loud sounds or vibration
can interfere and should be avoided. It can be operated remotely
across a network and the room can be unoccupied during the
analysis.
Auxiliary software is provided to simplify plotting of the
previously saved data files. These saved data files can still be
plotted using Gnuplot which is very comprehensive but driven from
the command line. The plotting utility software still uses Gnuplot
but is specifically designed to plot decrepigram files and has a
fully graphical interface. It facilitates superimposing multiple
results on a single plot to allow inter-sample comparison. The
plots are viewed on screen and can also be saved as .png image
files.
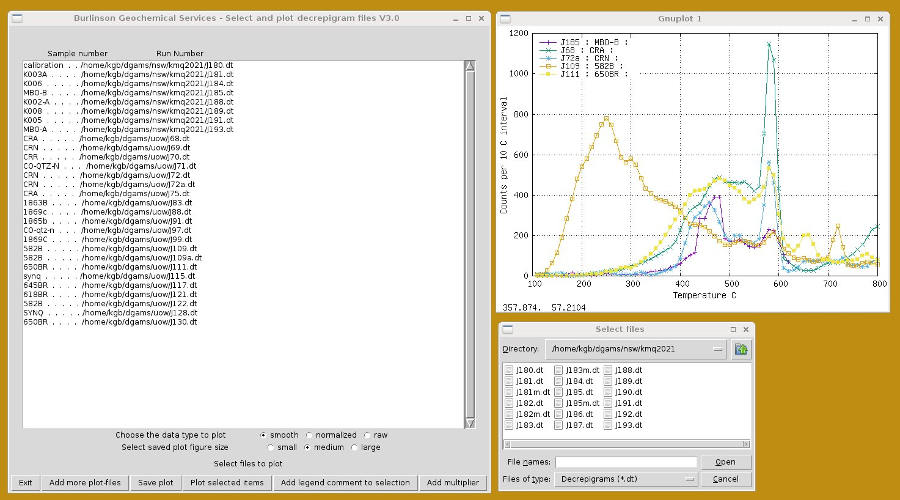
This is a screenshot of the plotting software (V3.0) for
decrepigram files in operation.
Files for plotting are selected in the "select files" window shown
here in the lower right. Multiple files or groups can be chosen and
added to the main listing in the left window. Files do not all need
to be in the same directory. The files to be plotted on a single
graph are then selected in the left window and multiple files can be
plotted together in a single plot window as shown in the upper
right. Comments can be added to individual files to appear in the
legend on the plot. Selected files can also have the data multiplied
so that all the plots show nicely at the same scale. Additional
selections and plots can be prepared as all the plot windows remain
visible to facilitate comparison and interpretation. The plots can
also be saved as .png graphics files in one of 3 different sizes for
addition to presentations or printing etc.
 Applied Mineral Exploration