Newest
Topics:
For the latest news, see the NEWEST TOPICS page.
Google is too dumb to let me put the list of news in this column and falsely claims that all my pages are self-duplicates.
Google-NONSENSE
Google's so-called "Artificial Intelligence" is an abuse of the concept of intelligence!
The Hall and Mt Hope Molybdenum deposits
Nevada USA.
This information added January 2014
Samples from the Hall molybdenum porphyry deposit, near Tonapah
in Nevada, USA were collected both on site and from Prof. Steve
Shaver's collection in 1990. The samples were analysed by
baro-acoustic decrepitation to understand the decrepitation
features of porphyry fluid systems so that decrepitation could be
used as an exploration method for porphyry deposits. Both these
deposits contained extensive quartz vein stockwork systems, and
this quartz was the dominant material sampled. Additional samples
from the nearby Mt Hope molybdenum prospect were collected in
1995.
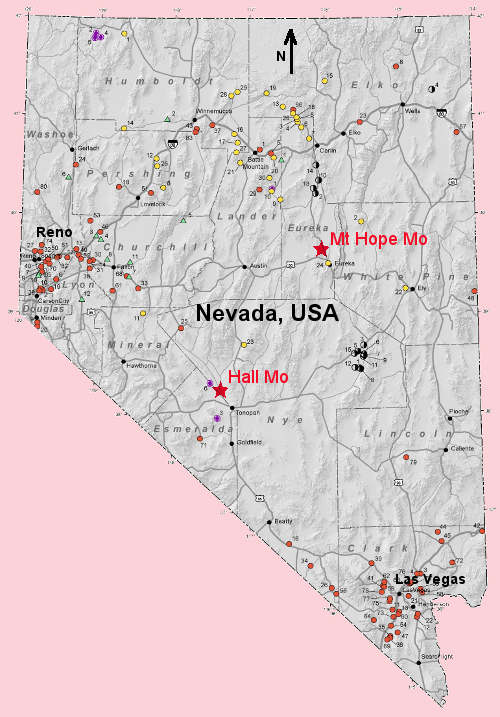
The locations of these deposits are shown on this map of Nevada.
Geology
The Hall Mo deposit was studied in detail by S. Shaver
and is described in his publication:
Geology, alteration, mineralization and trace element
geochemistry of the Hall (Nevada moly) deposit, Nye county,
Nevada. by S. A. Shaver, published in: Geology and Ore
deposits of the Great Basin, Symposium proceedings, April 1990.
Published by the Geological Society of Nevada, Reno, 1991.
This is the abstract of that publication:
Abstract
At the Hall molybdenum deposit, Nye County, Nevada, each of
two molybdenum-bearing, quartz monzonite stocks was emplaced
at 66-70 Ma (K-Ar and U-Pb) and underwent continuous inward
crystallization which was interrupted three times by the
successively deeper release of hydrothermal fluids. The stocks
are texturally concentrically zoned and each contains three
stacked molybdenum orebodies and overlapping zones of
alteration and mineralization. Regional geology, including
eastward dipping (40-80°) Tertiary volcanic rocks, and
paleomagnetic data indicate that the stocks and their
altetation/mineralization zones have been tilted some 70’
about a N30W axis and now plunge west at about 20°.
Mapping, petrogtaphic, and fluid inclusion studies indicate
that in each alteration/mineralization pulse, early
quartz-molybdenite + chalcopyrite 1 pyrite veinlets with
K-feldspar envelopes (T=470-750°C; wt. % NaCl eq. = 8-19%)
were followed by muscovite ± quartz ± pyrite
± fluorite (greisen) veinlets with envelopes
ofcoarse-grained (1-23 mm) muscovite. Later fluids in some
pulses formed quartz-magnetite veinlets or chlorite-enveloped
(quartz-pyrite-chalcopyrite+magnetite) veins, but all pulses
were ultimately closed by base-metal veins
(quartz-galena-sphalerite-chalcopyrite ± tetrahedrite
± pyrite) having no alteration envelopes
(T:370-450°C; wt. % NaCl eq. = 50-41%). Molybdenum
orebodies are related to both abundance of, and
molybdenite concentration in, quartz-molybdenite veinlets,
with successively deeper orebodies, related to successively
deeper phases of each stock, consistently lower in grade.
Copper anomalies (200-1000 ppm) generally occur with high
molybdenum concentrations (400-2000 ppm) as a result of the
nearly ubiquitous occurrence of chalcopytite in the
quartz-molybdenite veinlets. Fluorine anomalies (1000-21,000
ppm) are related to greisen veinlets and occur 30m to more
than 100m outward of molybdenum anomalies. Tin anomalies are
generally weak (5-25 ppm) and either coincide with high
fluorine concentrations (in one stock) or are sporadically
distributed (in the other stock). Tungsten anomalies are also
weak (5-18 ppm) and, although locally present with tin and
fluorine anomalies, are more typically sporadic in
distribution. Lead (300-5000 ppm), zinc (200-4000 ppm),
manganese (150-3200 ppm), and silver (3-30 ppm) anomalies are
related to base-metal veins and occur 40-150 m outward of
molybdenum highs. Arsenic is sporadically distributed in
general, but correlates well with base-metal anomalies where
copper anomalies are also present. Weak gold anomalies (10-25
ppb) occur with high base-metal concentrations, as do sporadic
bismuth anomalies (2-18 ppm). Lithium (16- 56 ppm),
thallium (0.9-1 .9 ppm), antimony (5-11 ppm), and niobium (S-9
ppm) anomalies are sporadic and do not correlate with other
elements.
Elemental dispersion patterns are interpreted to be
overwhelmingly hypogene in nature, although remobilization of
some elements during post-vein sericitic and argillic
alterations may have occurred. Such late alterations are
pervasive and post-ore, and are unrelated to discernable
microfractures or veins. Preliminary isotopic data suggest
both sericitic and argillic alterations formed from fluids
having significant meteoric components, in contrast to
magmatic—fluid—dominated main—stage events.
And this is the conclusions from that same paper:
Conclusions Each of the two now-tilted stocks at Hall was
produced by a single injection of magma which crystallized
progressively inward until internal magmatic and fluid
pressures were sufficiently high to fracture the crystallized
stock carapace, “pressure quench” the magma to a limited depth
beneath the carapace, and release accumulated hydrothermal
fluids which altered and mineralized both the carapace and
pressure—quenched porphyry beneath. Pressure quenching and/or
formation of crenulate quartz layers appear to have adequately
sealed the magma at depth to permit repeated buildups of
pressure and repeated releases of hydrothermal fluids from the
same magma body. Three pulses of fluid release occurred via
this mechanism in each of the two stocks at Hall to produce
five temporally distinct molybdenum orebodies (generally 400
to > 1000 ppm Mo), and to produce distinct but overlapping
zones of alteration and mineralization in each stock. Veinlets
produced during these alteration and mineralization pulses
were not emplaced as random stockworks, but rather in two
dominant sets whose orientations may be radial and concentric,
respectively, to the host stock phase. Because successively
later pulses in each stock were associated with magma which
was successively deeper in the magma column and therefore more
completely crystallized at the time of fluid release, the
stocks display stacked orebodies and a concentric textural
zonation. The oldest orebody in each stock in generally within
and associated with the finest—grained, highest percentage
groundmass, apical phase of each stock, and successively
younger orebodies in each stock are related to (and within)
phases which are successively deeper, coarser-grained, and
poorer in groundmass.
During each alteration and mineralization pulse, fluids are
interpreted to have been partly buffered along a
K—feldspar/muscovite univariant curve, evolving during cooling
toward higher K‘/H‘ ratios. Main—stage alteration thereby
progressed in all pulses from albitic to potassic to greisen.
These types of alteration appear to have taken place under
largely lithostatic pressure conditions. Greisen alteration
was followed in different pulses by various vein types whose
characteristics suggest more nearly hydrostatic pressure
conditions. All pulses in each stock appear to have been
closed by base-metal veins (370—448°C). However, the
second pulse produced late chlorite—enveloped veins and the
final pulse in each stock appears to have also formed late
quartz—mt veinlets. Base—metal veins account for distal
Pb-Zn—Mn—Ag + As anomalies at the deposit.
Albitic alteration in both stocks is ubiquitous, but weakly
developed, and appears to be late magmatic in origin in rather
than related to any hydrothermal veins. Potassic alteration,
generally related to quartz—molybdenite (+ cp ± py)
veinlets with secondary K-feldspar haloes, decreases in
intensity with depth in each stock as a result of a decreasing
density of quartz—molybdenite veinlets. Greisen veinlets and
greisen alteration likewise decrease in intensity with depth.
Quartz—molybdenite veinlets (and associated Cu and Mo
anomalies) in each pulse are generally distributed in a
cupola—shaped zone within and slightly above the associated
intrusive phase. Greisen veinlets (musc + quartz, py, fluorite)
followed the quartz—molybdenite veinlets in each pulse. These
produced fluorine and, locally, tin anomalies and are
distributed in a similarly—shaped cupolar zone which extends
outward of and overlapping the zone of quartz-molybdenite
veinlets. Differences in veinlet density (both greisen and
quartz—molybdenite) between successive phases in each stock
are too great to have resulted from overlapping of veinlets
from different pulses and suggest that a gradient in volatile
content was present in the magma column from which each stock
crystallized.
It is not clear from the work at Hall whether Climax-type
deposits and quartz monzonite type deposits evolved from
similar parent magmas, but many of the differences in
petrology, alteration, and mineralization are consistent with
shallower depths of emplacement for the Climax-type deposits
(0.6 — 3.1 km) and deeper emplacement for the quartz
monzonitic deposits (>4—3 km).
The Mt Hope deposit was merely an exploration prospect with very few
drillholes at the time of sampling and there was almost no
geological control for the samples which were collected during an
organized geological group tour. This area is now being developed as
a mine and some geological
information is here.
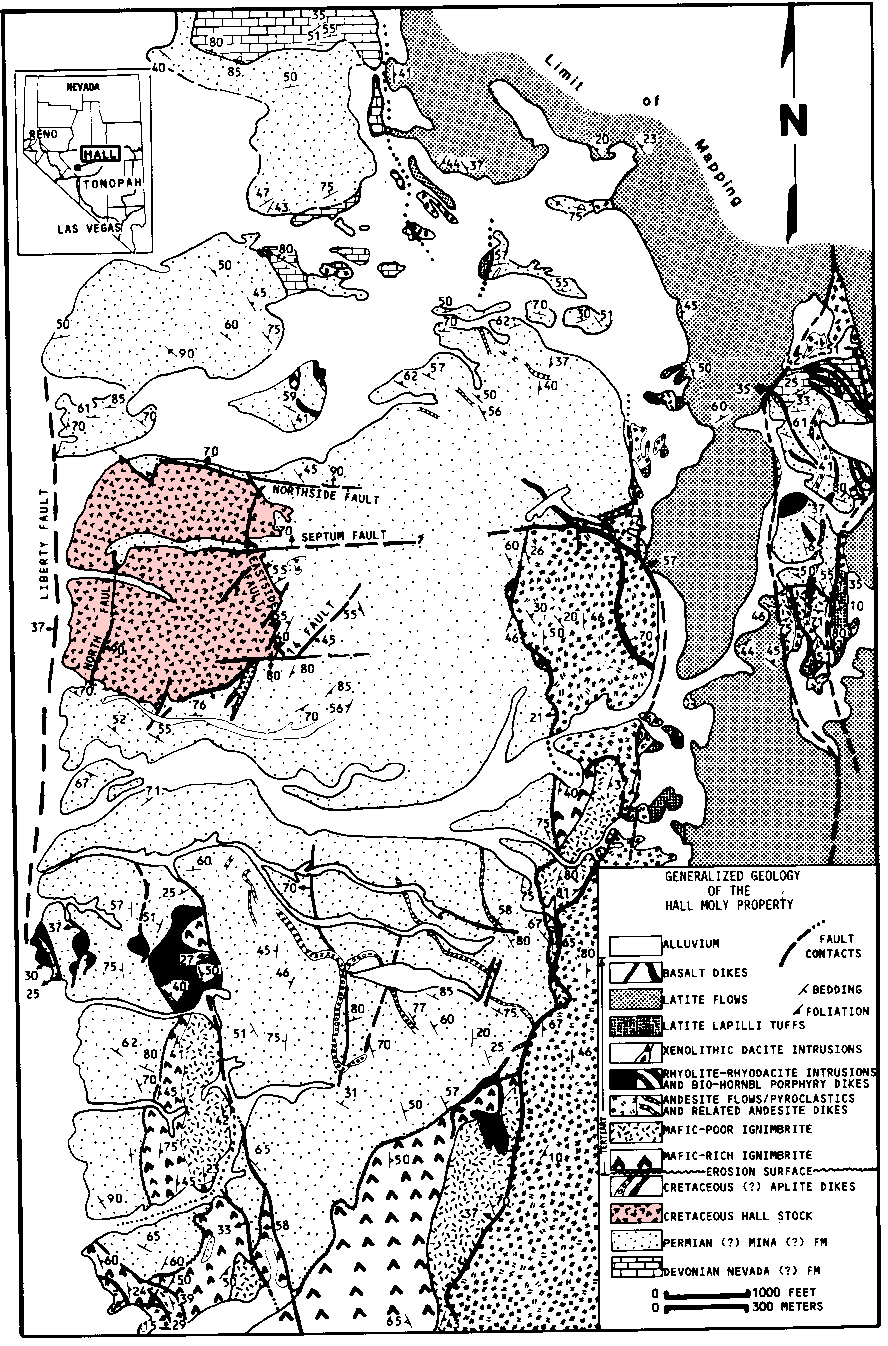
This map of the regional geology near the Hall deposit is by S.
Shaver and is from his publication listed above.
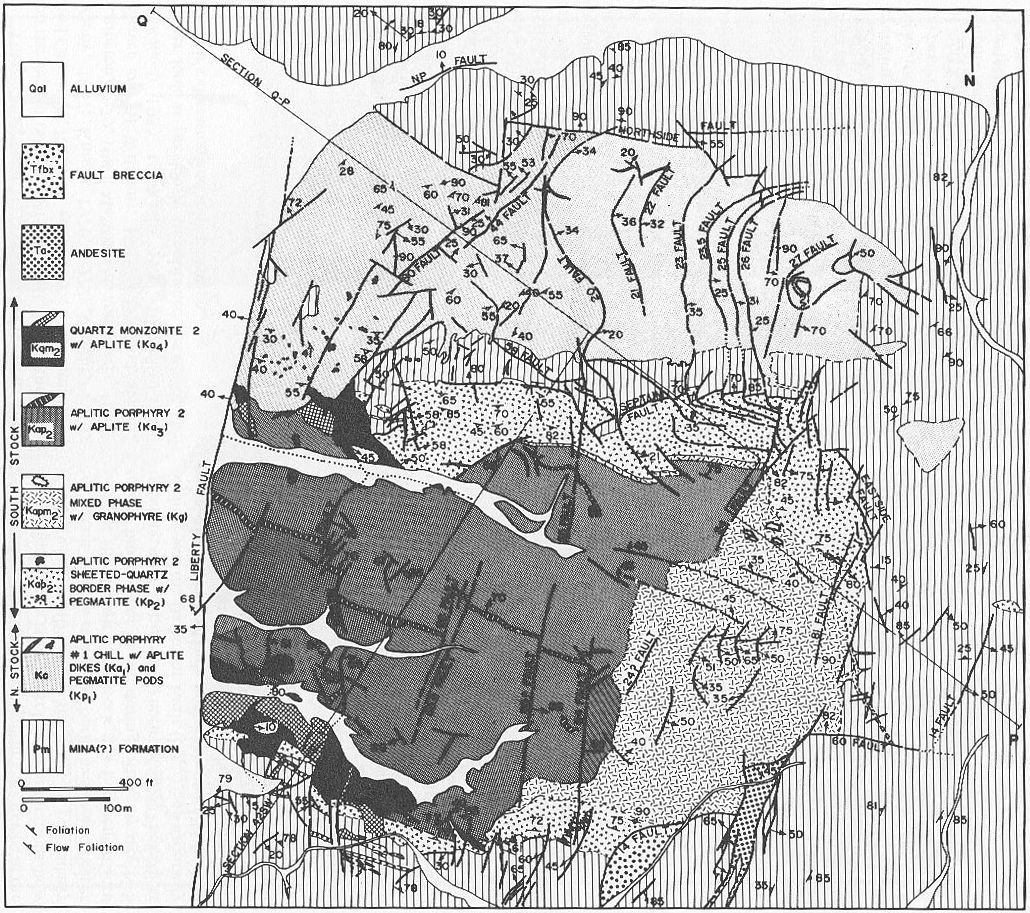
And this is a detailed map of the Hall stock, also by S. Shaver from
the same publication.
S. Shaver identified many different phases within the stocks
which he labeled with codes like Kqm2 etc. Where known,
these phase codes are also used on my samples to try and relate
fluid inclusion populations to the mapped crystallization and
hydrothermal fluid stages.
Summary of the baro-acoustic decrepitation study
The decrepitation results show quite complex curves caused by the
presence of multiple fluid inclusion populations in all these
samples. Many samples show decrepitation peaks near 400 C, 430 C
and/of 480 C and these variations could be useful in identifying
the locations of mineralization. A few results from the Mt Hope Mo
prospect, near Eureka Nv., showed similar decrepitation patterns (plotted here) and this suggests that Mt Hope
also contains Mo mineralisation.
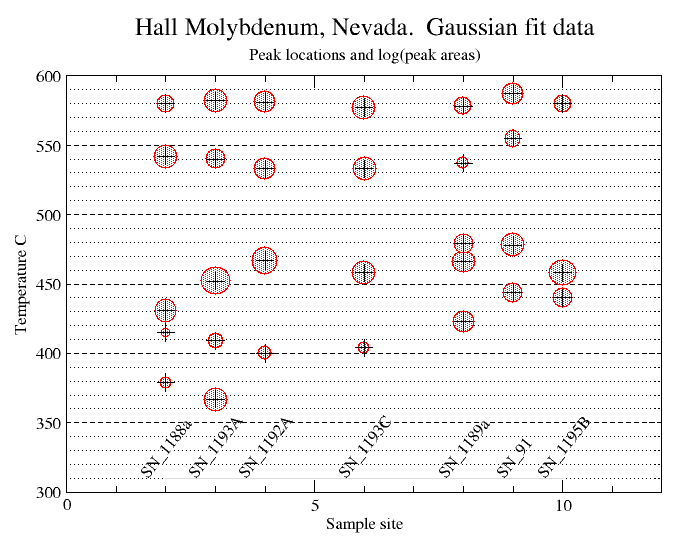
Seven samples were selected for detailed interpretation using curve
de-convoultion. (discussion here) These samples from the
Hall deposit show quite complex combinations of fluid inclusion
populations, often with 5 components required to give a good fit
to the data. Most samples show a component with a temperature mode
near 450 C as well as about 540 C. Note that the peak at 580 to
590 C is related to the alpha - beta quartz transition and is not
used in interpretation (explanation here). A
significant number of samples also have a distinct component with
a low mode temperature near or below 400 C. This separate low
temperature component can be used to classify the quartz into at
least 2 major types. Only sample 1188A had visible molybdenite,
which was abundant, but most if not all of these samples are from
potentially molybdenum bearing phases according to Shaver's
classification scheme. This plot summarises the individual fit results showing the
mode temperature of each component, with the size of the peak
(logarithmic area) represented by the circle diameter at each
plotted point. Note the presence of 350-400 C peaks on the 4
leftmost samples, and the lack of this temperature on the
rightmost samples.
(Sample SN_91 on this plot is actually SN_91-617)
This limited study of only 7 samples, together with the lack of
location information for some samples makes it impossible to
actually determine what decrepitation features might be used to
directly pinpoint mineralized quartz veins. However, the great
variations observed do suggest that fluid inclusion decrepitation
data within porphyry systems has the potential to identify and
outline features of importance which could facilitate exploration.
Most samples were collected during an organized geology tour of
the mine in 1990. Samples with the same number but different
letter suffixes are multiple subsamples collected from a single
location but within a radius of a few metres.
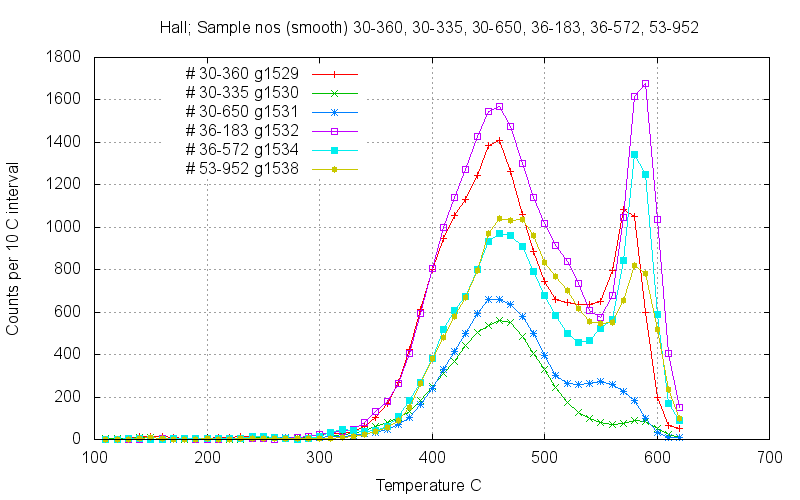
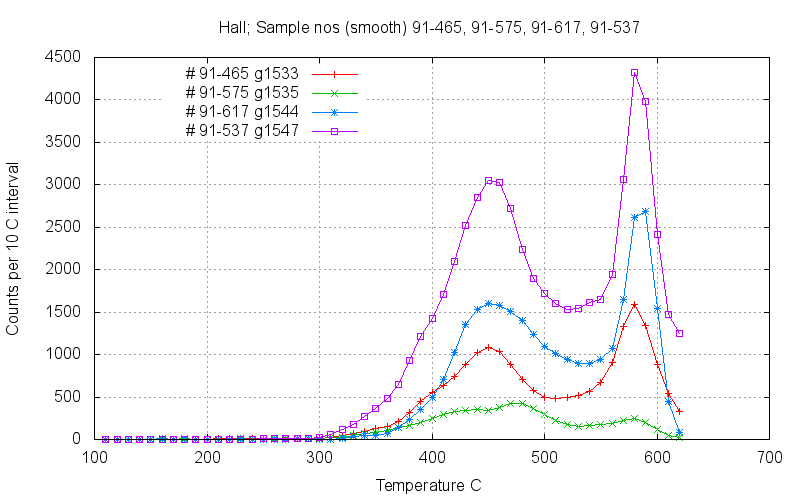
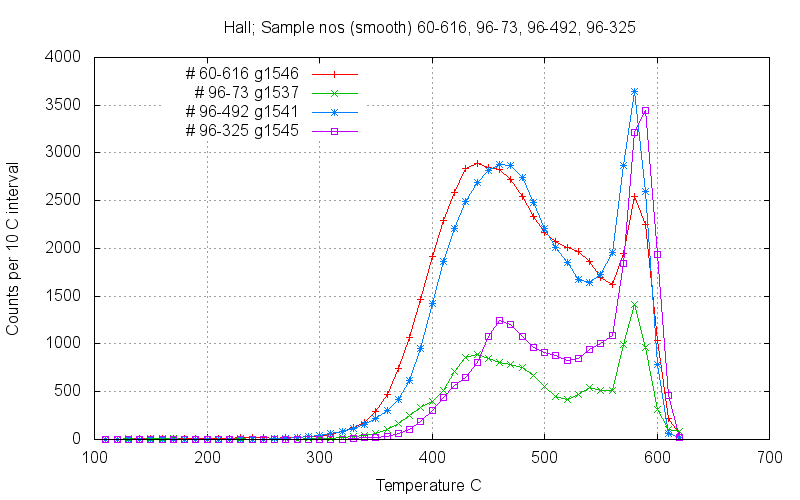
17 of the 18 samples in these first 5 graphs are from S. Shaver's
collection and sample locations and details are unknown. A list of sample
descriptions is here (opens in a new tab)
None of the samples show low temperature decrepitation below
350C, which indicates that the fluids lack any CO2.
However, there are a range of peak temperatures between 350 C and
500 C which indicate substantial variations in the fluid
temperatures during quartz formation. These variations may be
useful as a diagnostic to identify different stages of the
mineralising processes. But without geological and location
information on these samples, the significance of these
temperature variations cannot be interpreted.
Note the distortion of the peaks near 400 C, particularly on
samples 36-183 and 30-360 (magenta and red) due to a subordinate
decrepitation peak near 400 which affects the shape of the main
peak at 450 C.
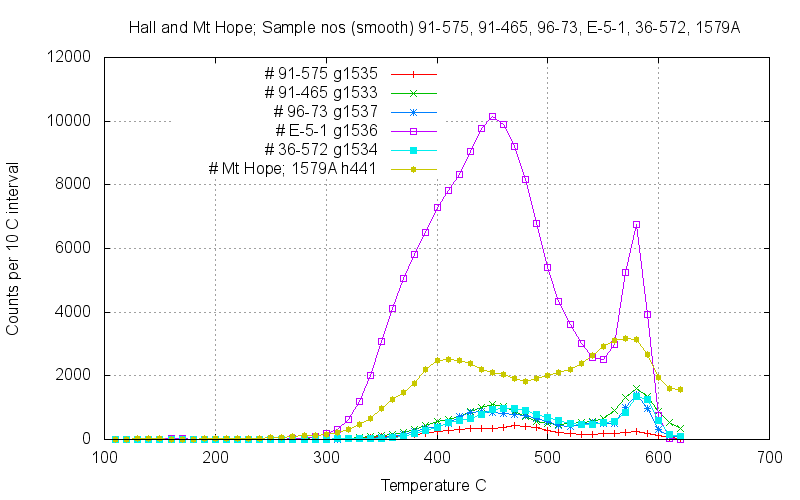
Sample E-5-1 (magenta) has a pronounced subordinate peak near 380 C,
while The comparison sample from the Mt Hope prospect (1579A,
yellow) shows a distinct 400 C peak instead of a peak at 450 C.
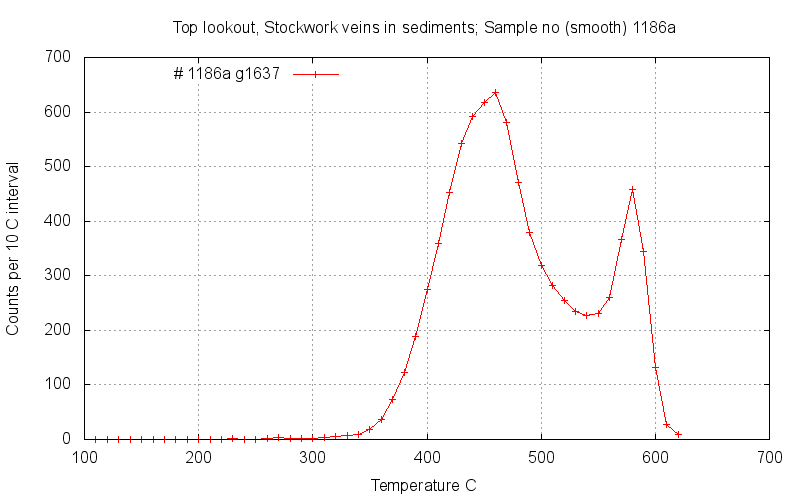
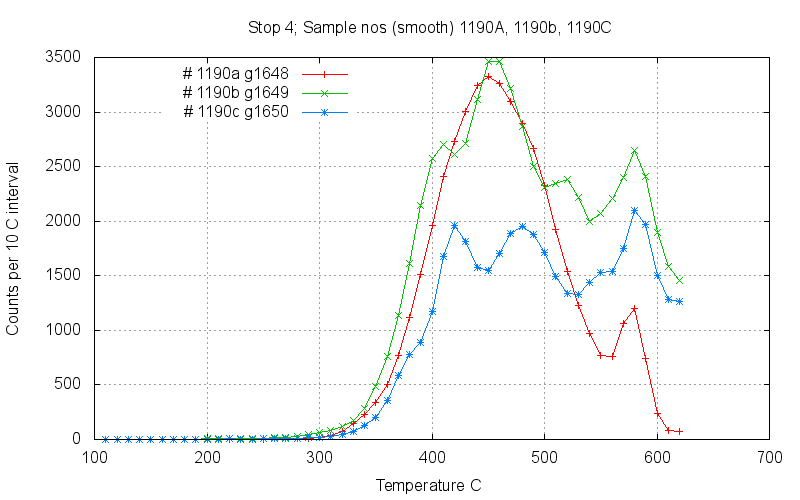
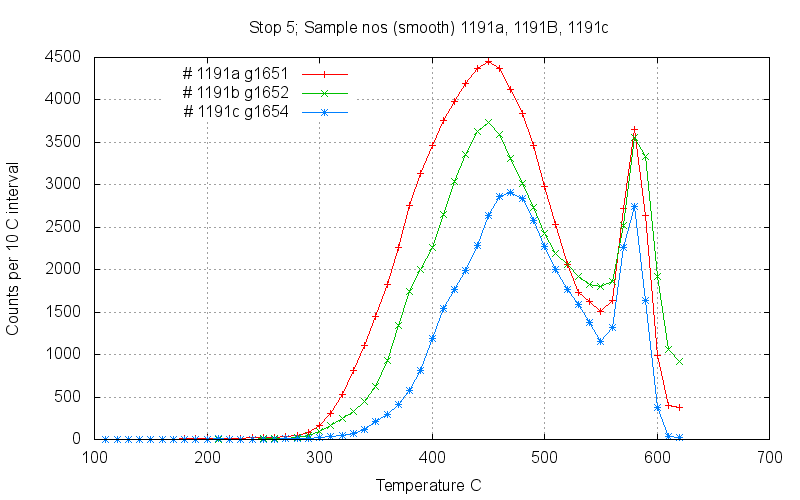
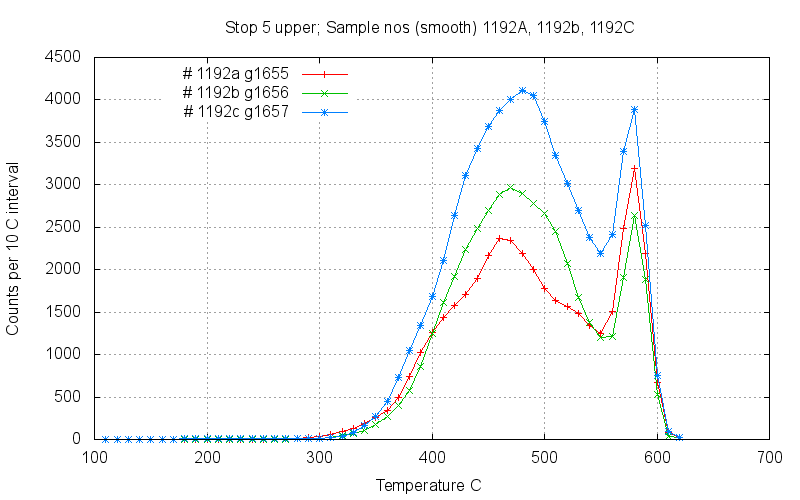
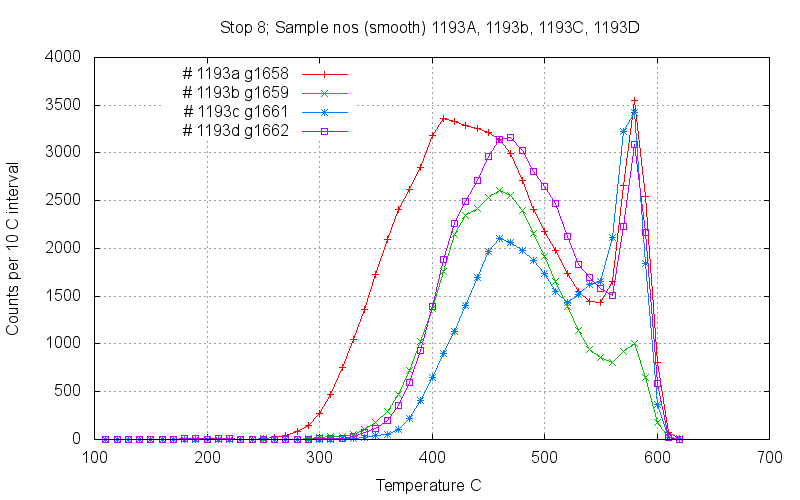
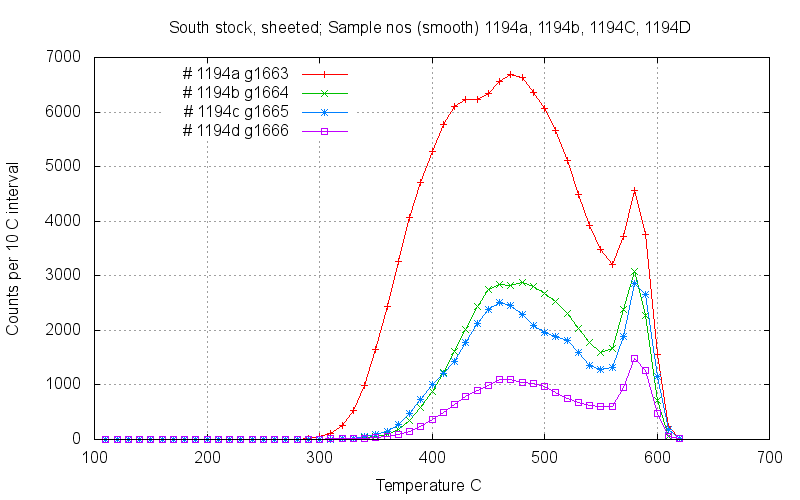
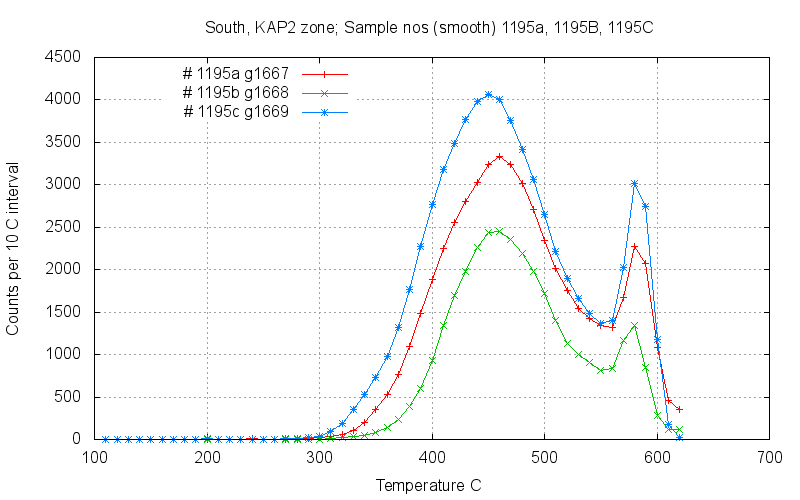
Samples in the following graphs were collected on an organized group
tour. Sample details are here.
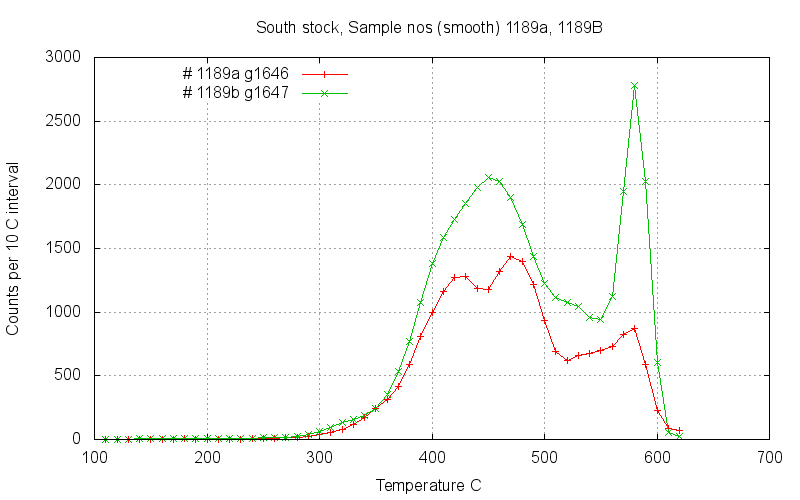
In the following graphs the subsamples (with the same number, but
different alphabetic suffixes) from each location are plotted
together which shows the amount of local small-scale variation in
the samples.
Sample 1186A is of quartz hosted in sediments outside but near to
the Hall stock and lacks the lower temperature (400C)
decrepitation peak.
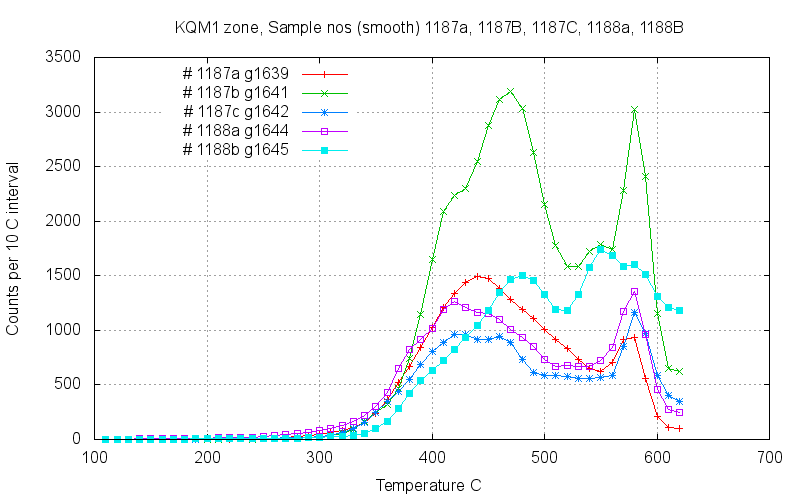
The mineralized quartz within the Hall stock shows complex
decrepitation, frequently with a decrepitation peak just below 400 C
as well as the common peak near 450C. And in some samples
decrepitation peaks around 550 C also occur, such as sample 1188B
(cyan). Note that these two samples 1187 and 1188 are from the same
location.
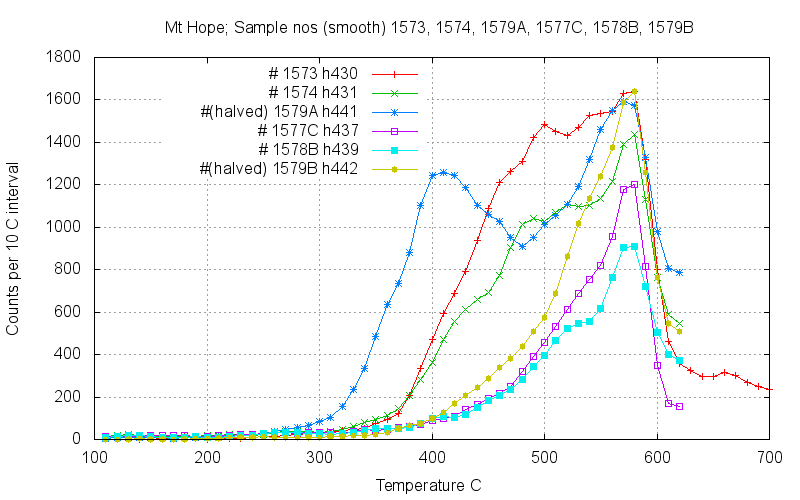
Mt Hope molybdenum, Nevada
These samples are from the Mt Hope prospect, for comparison. Most
samples (not shown) lacked the 400 C and 450 C peaks commonly seen
in the Hall samples, but samples 1579A (blue), 1573 (red) and 1574
(green) do have decrepitation peaks at 400 C and 450 C as seen in
the Hall samples. This similarity suggests the Mt Hope could host
molybdenum mineralization.
 Applied Mineral Exploration