Newest
Topics:
For the latest news, see the NEWEST TOPICS page.
Google is too dumb to let me put the list of news in this column and falsely claims that all my pages are self-duplicates.
Google-NONSENSE
Google's so-called "Artificial Intelligence" is an abuse of the concept of intelligence!
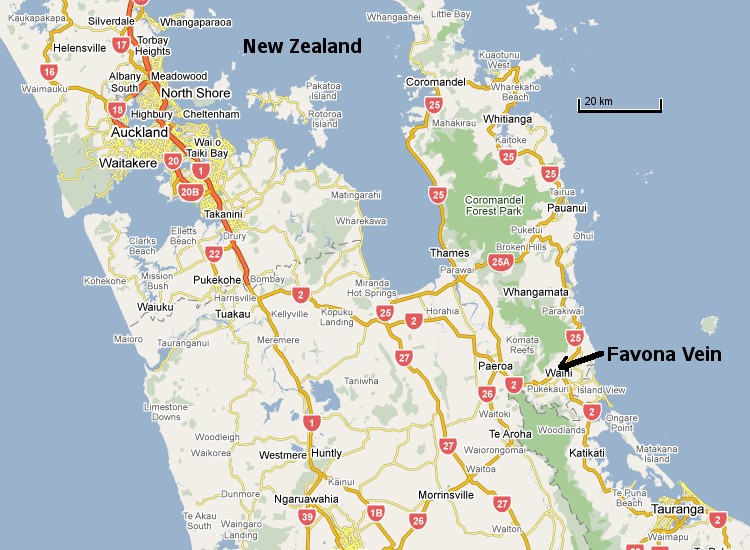
Baro-acoustic
decrepitation of samples from the Favona vein, Waihi, NZ
A study of epithermal Au and Ag
mineralised quartz from this area on the North Island of NZ was
undertaken with Penelope Small and Prof. Andrew Rankin of Kingston
University, Surrey and the cooperation of Newmont.
Ten samples
were collected from drill core in an attempt to determine spatial
temperature and fluid composition variations with depth and
horizontal position within the vein.
Interpretation
The
samples show low decrepitation
intensities, as expected for dominantly vapour filled, high level
epithermal fluid inclusions in quartz. However it is still possible
to discern important differences between the samples which seem to
correlate with Au mineralisation. In particular, there is evidence
for the presence of CO2
rich fluids correlated with the best mineralised samples. Despite
the low decrepitation intensities, this data clearly shows a strong
correlation between known gold grades and the presence of low
temperature gas-rich decrepitation.
There
are also variations of the decrepitation temperatures of the main
peak near 400 C which suggest the technique is capable of mapping out
thermal gradients within the quartz system, and these variations are
likely to also correlate with mineralisation potential.
Incomplete
sample location information and sparse sampling limit the complete
interpretation of this data at present.
These initial
plots have been grouped based on the Au contents of the
samples.
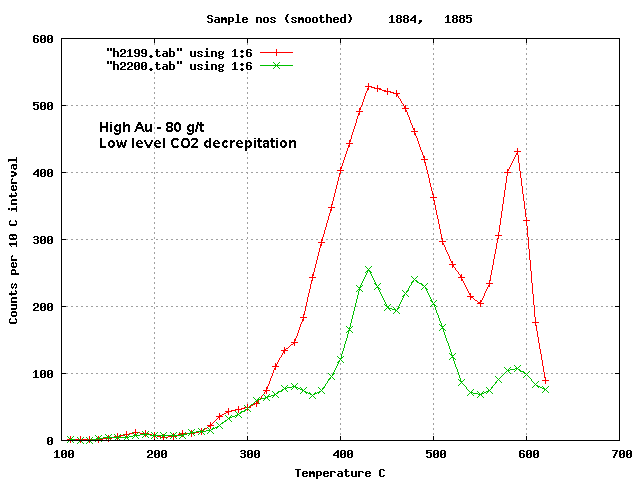
The
above samples with high Au contents, about 80 g/t, show distinct
decrepitation at low temperature near 300 - 350 C which is typical of
samples which contain CO2
rich fluid inclusions. These samples are from an unspecified
location, thought to be UW67 (not UW167) at about 950m RL in the
Favona vein.
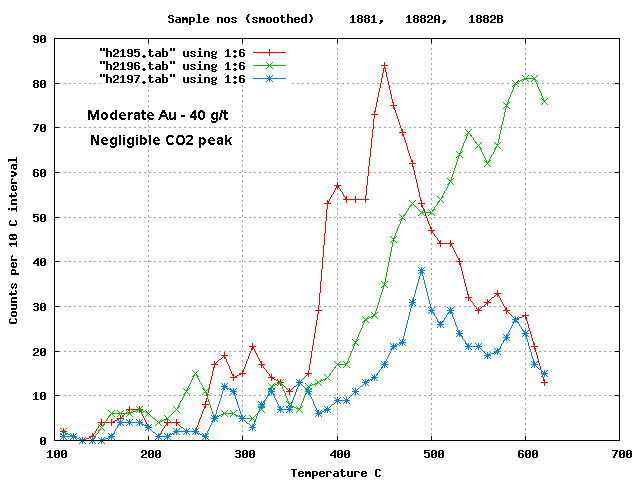
Samples
with moderate Au contents, about 40 g/t, lack this low temperature
decrepitation. These samples also have very low intensity of
decrepitation which is typical of high level epithermal inclusions,
which are often vapour rich and do not decrepitate well. These samples
are also from about 950m RL in the Favona vein.
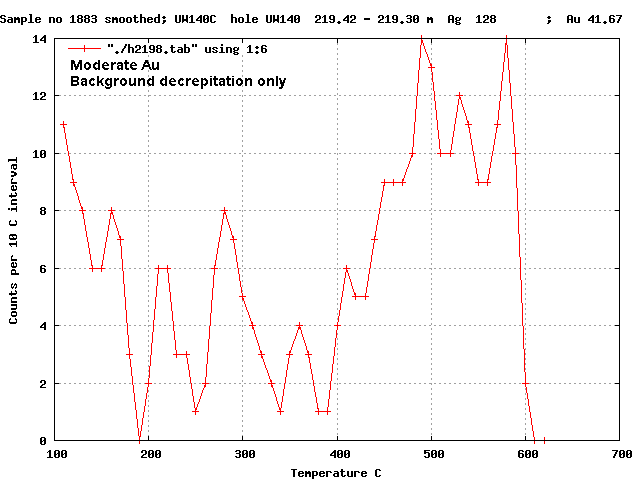
This
sample, with 40 g/t Au shows only background decrepitation. This is
interpreted to be a vapour rich area of the vein system. This sample is
also from about 950m RL in the Favona vein.
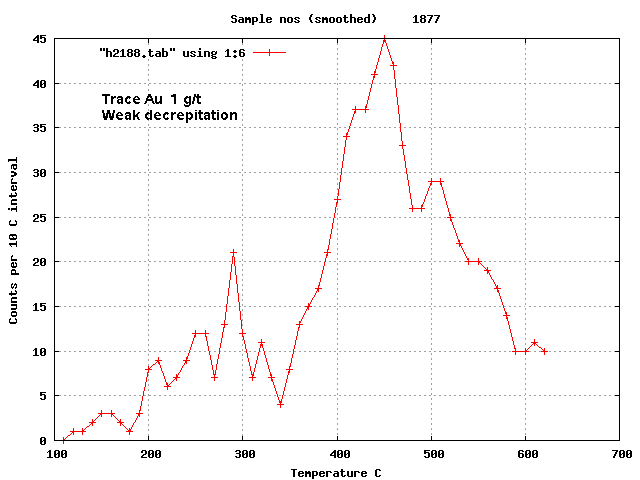
This
sample with only low level Au of about 1 g/t shows weak, but
distinct decrepitation and perhaps a hint of CO2
rich inclusions. This sample is located close to the main ore zone
and the fluid inclusions indicate that good mineralisation is nearby
despite the low chemical analysis result. It is from about 900m RL in
the Favona vein.
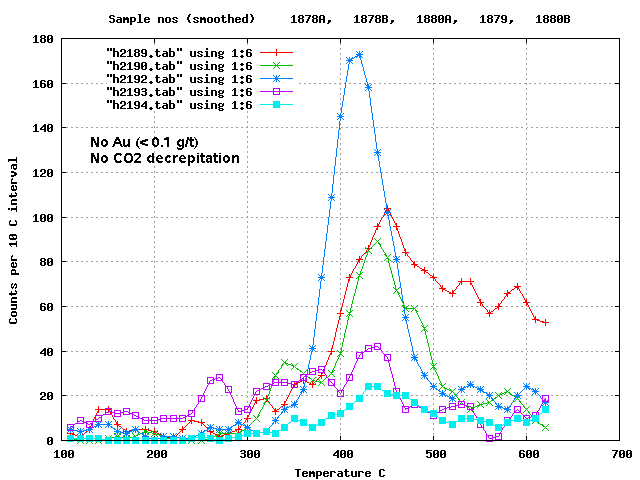
These
samples have < 0.1 g/t Au and are distant from the active
workings. The decrepitation results show a lack of CO2
and suggest low mineralisation potential. Note that there are
significant differences in the temperature of the main peak and with
sufficient sample coverage these variations might be mapped to
show thermal gradients within the quartz vein system. Samples 1878 and
1880 are from the Moonlight area, while sample 1879 is from Deep in the
Favona vein, about 700m RL.
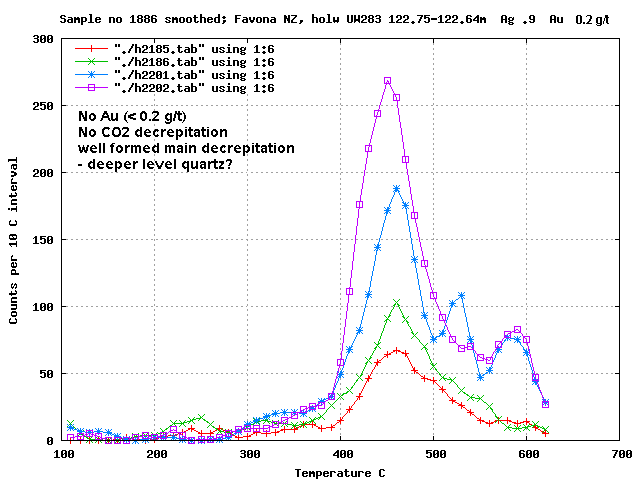
These
samples have only <0.2 g/t Au and lack low temperature
decrepitation and CO2.
The more intense decrepitation and better shaped peaks suggest this
quartz contains more liquid rich inclusions, probably formed at
greater depth and pressure than other samples in this study, despite
being collected shallower than other samples.
The green plot is the same sample as the red, done at higher
instrumental sensitivity. The blue, magenta and green plots
are 3 splits of the same sample to check for homogeneity. This sample
is from the Favona South shoot at about 1000m RL.
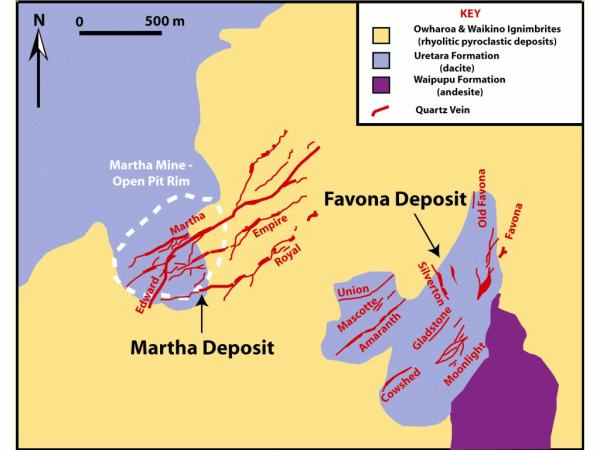
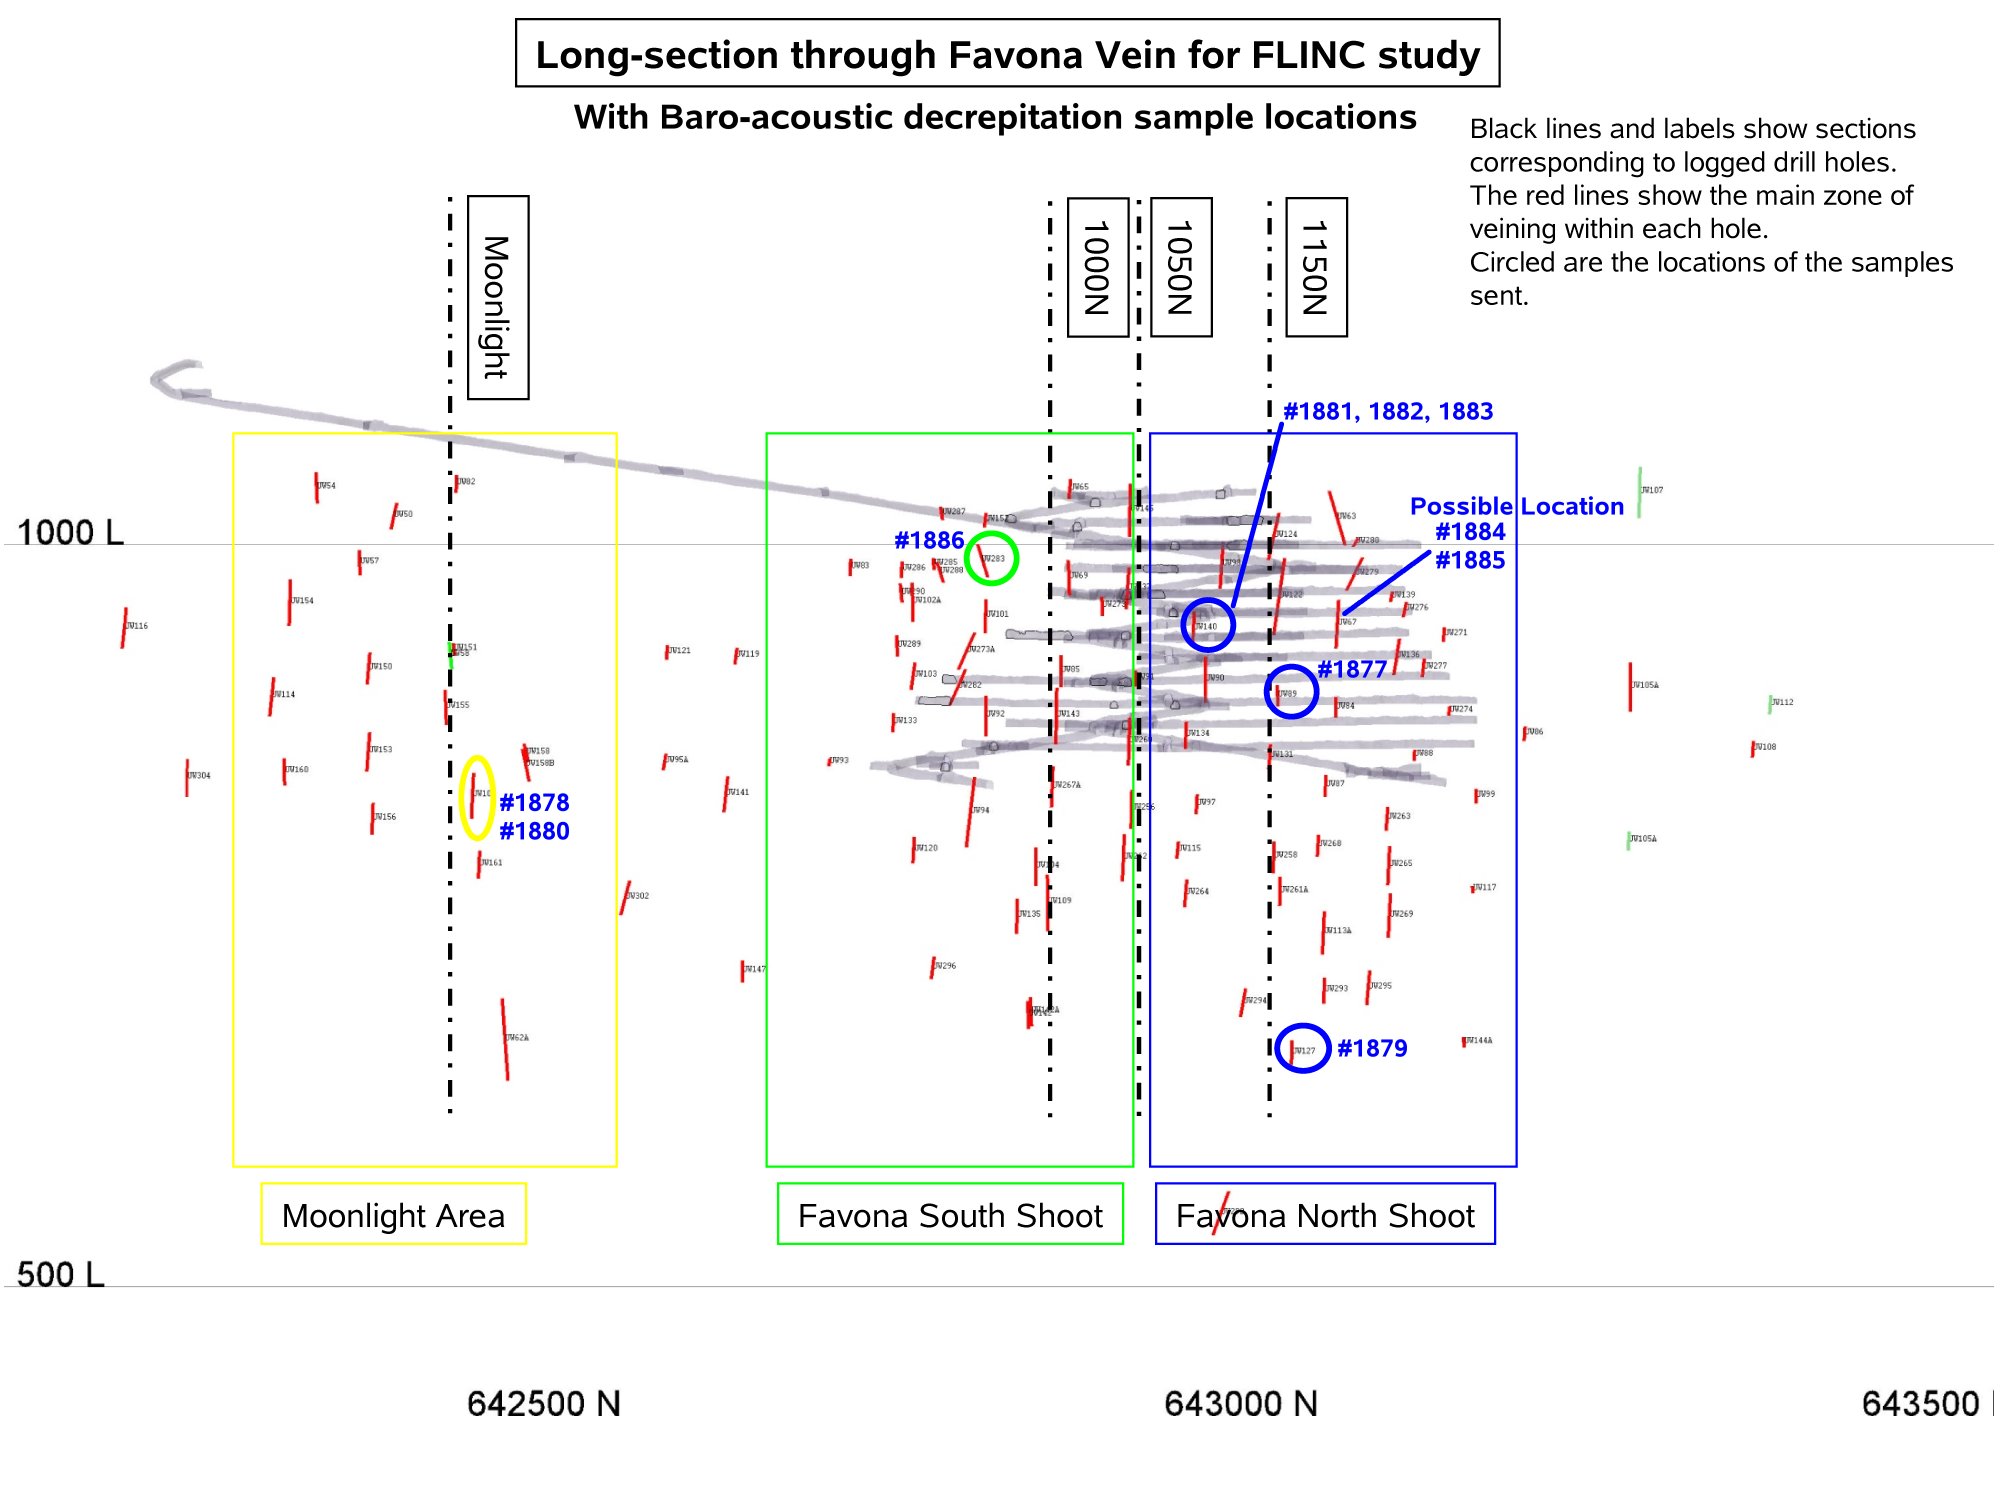
Sample locations
The deposit comprises a swarm of quartz veins, shown here on a surface geology map
The locations within the mine are shown on this N-S
pseudo section. Samples 1884 and 1885 were wrongly described by the
student and are shown here at their probable location.
The thick grey lines are the mine workings and entrance adit.
The sample locations and gold analyses are in this table.
Sample
ID
Location
Sample
#
Run
#
Drill
Hole
From
(m)
To
(m)
Box
No.
Ag
(g/t)
Au
(g/t)
UW140A
Fav, 950 RL
1881
H2195
UW140
220.00
219.86
84
128.00
41.67
UW140B
Fav, 950 RL
1882
H2196, H2197
UW140
219.80
219.77
84
128.00
41.67
UW140C
Fav, 950 RL
1883
H2198
UW140
219.42
219.30
84
128.00
41.67
UW167A
Fav 950 RL?
1884
H2199
UW167
296.43
296.25
105
56.80
78.70
UW167B
Fav 950 RL?
1885
H2200
UW167
295.75
295.63
105
56.80
78.70
UW100A
Moon 800 RL
1878
H2189, H2190
UW100
355.15
355.00
118
2.90
0.12
UW100B
Moon 800 RL
1880
H2192, H2194
UW100
350.57
350.43
119
2.90
0.12
UW283a
Favona South
1000 RL
1886
H2185, H2186, H2201, H2202
UW283
122.75
122.64
85
1.90
0.23
UW127c
Fav, 650 RL
1879
H2193
UW127
537.82
538.00
104
10.80 to 0.14
5.60 to 0.06
UW89d
Fav, 900 RL
1877
H2188
UW89
241.65
241.50
83
15.79 to 1.82
3.00 to 0.86
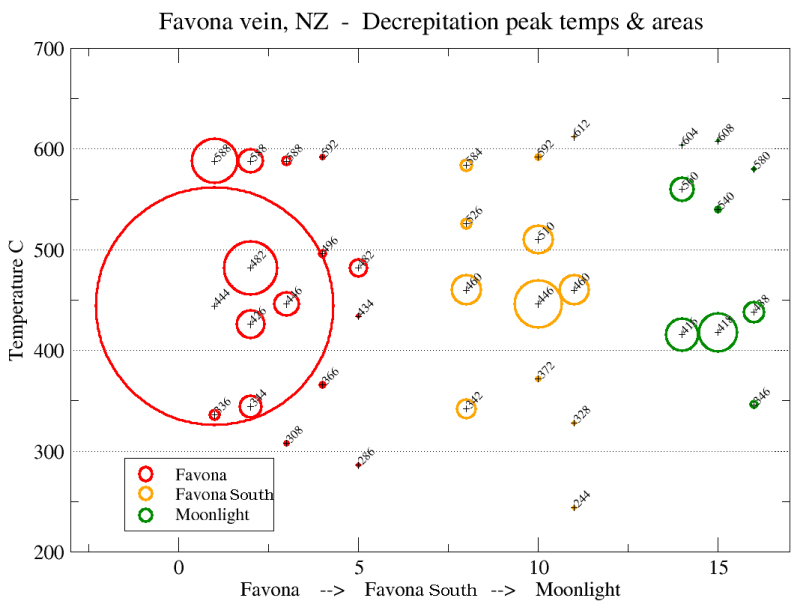
De-convolution
of each decrepigram was carried out to determine the individual
component skewed-gaussian populations present in each sample and this
data is plotted below, where the circle diameter at each temperature is
proportional to the decrepitation intensity of that component
population.
The better mineralised
Favona main shoot (red) has more intense
decrepitation and small but measurable low temperature, gas-rich
inclusion decrepitation. The Favona South shoot (yellow) has less
decrepitation and slightly less low temperature gas-rich decrepitation.
And the Moonlight area (green) has much less low temperature gas-rich
decrepitation. From this it is seen that the best exploration
areas are in fact in the shallow areas of the Favona South shoot, which
looks more promising
that even the deep samples from the Favona main shoot (sample 1879).
The data show that the Moonlight area is not a particularly promising
exploration target.
 Applied Mineral Exploration