Newest
Topics:
For the latest news, see the NEWEST TOPICS page.
Google is too dumb to let me put the list of news in this column and falsely claims that all my pages are self-duplicates.
Google-NONSENSE
Google's so-called "Artificial Intelligence" is an abuse of the concept of intelligence!
Exploration for gold using Fluid Inclusions
The acoustic decrepitation technique.
Kingsley Burlinson
Presented at the AAG conference, Oviedo, Spain, 2007
Abstract
The use of fluid inclusions in exploration is frequently overlooked
because conventional microthermometric measurements are slow, tedious
and rarely definitive. However by using acoustic decrepitation, useful
exploration data can be acquired quickly and reproducibly. The results
can readily identify CO2 rich inclusion fluids, in addition
to providing relative temperatures of aqueous fluids to outline
palaeo-thermal temperature gradients in hydrothermal quartz systems.
Samples from several gold mines in the Hebei province of China show that CO2 rich fluids are quite rare in this region, in contrast with the common occurrence of very CO2
rich fluids in typical archaean gold deposits. Because the microscopic
studies on these deposits concentrated on the rare but prominent CO2 rich inclusions, the deposits have been wrongly classified as being derived from CO2 rich fluids, wheras acoustic decrepitation shows that those CO2 rich fluids were merely minor phases of the overall hydrothermal system.
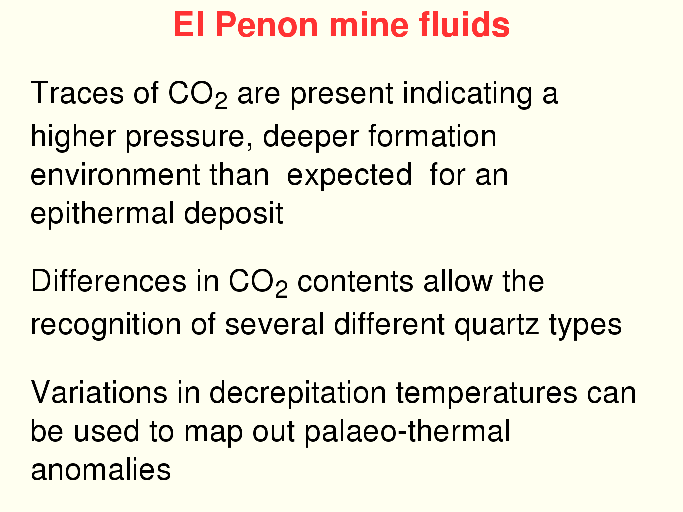
At the El Penon epithermal gold deposit in Chile, there are some CO2
rich fluids present, indicating a deeper and higher pressure origin
than is usual for epithermal deposits. Variations in the aqueous fluid
temperatures of about 50 C suggest that mapping of paleo-thermal
gradients can be done, which may help to outline favourable mineralised
zones within the quartz system.
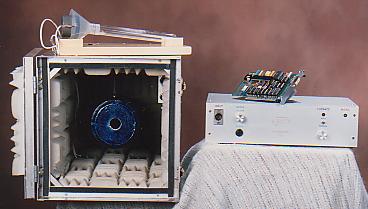
The BGS model 105 decrepitometer is a completely automated digital instrument whiich works together with a desktop computer.
Previous decrepitation efforts failed to understand critical issues.
The fluid inclusion decrepitation method was first used in the 1940's
as a method to measure homogenisation temperatures. The method was soon
replaced by microthermometry which was recognized as being more
accurate for determining these temperatures. However, it was not
understood that much of this early decrepitation work was subject to
interference caused by the presence of CO2 rich fluid
inclusions. Consequently much of the criticism of the technique, which
led to its demise for academic research purposes, is now known to be
inappropriate. The technique was subsequently used in Russia and China
in the 1970's in exploration programmes, in which economical and rapid
analyses are more important than modest inaccuracies.
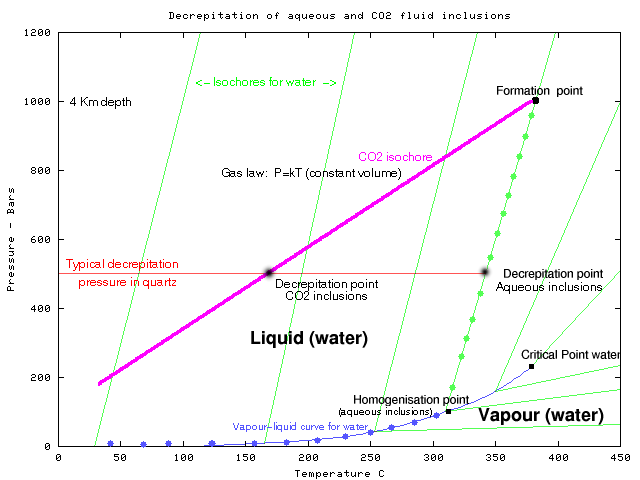
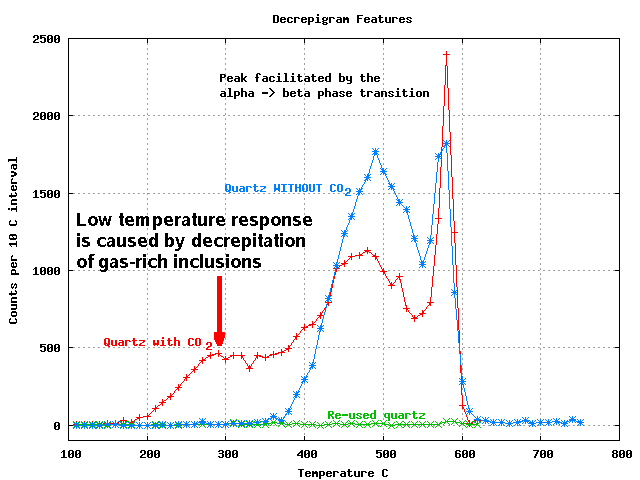
However, even this work failed to recognize the importance of the effects caused by the presence of CO2 rich inclusions. It was not until 1983 (Burlinson, K., 1984) that the effect of CO2 rich fluid inclusions upon decrepitation data was recognized. Such CO2
rich fluid inclusions develop high internal pressures at low
temperatures resulting in decrepitation long before the inclusion
reaches homogenisation temperature. This behaviour is frequently
observed in microthermometric studies where it is a major problem when
trying to measure the homogenisation temperature. However, this
decrepitation gives rise to distinctive low temperature peaks on
the acoustic decrepigrams which can be used to recognise the presence
of CO2 rich fluid inclusions. This led to the recognition that CO2
measurements by acoustic decrepitation could be used as an exploration
technique for Au deposits as they are often associated with CO2 rich hydrothermal fluids.
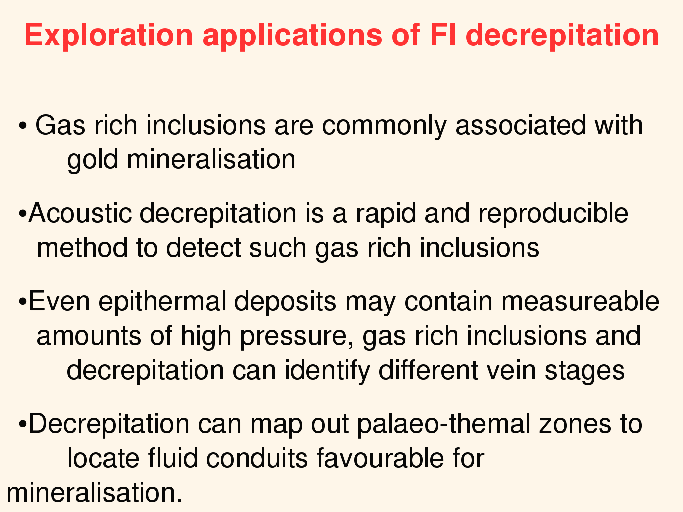
Decrepitation and CO2 in exploration
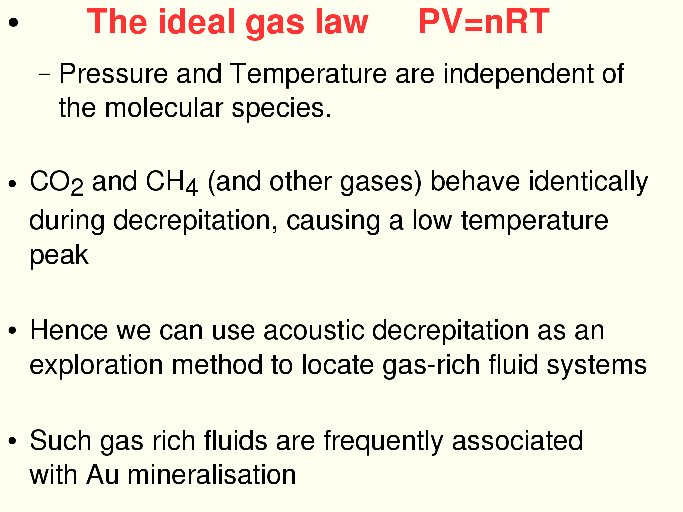
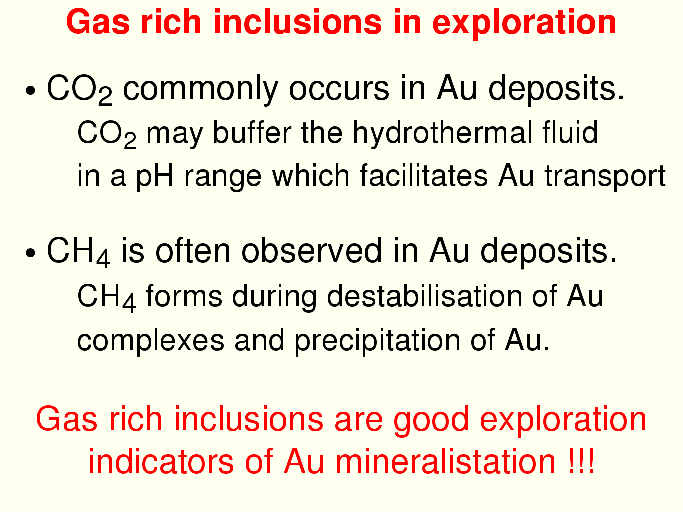
Many workers have noted a common association between gold mineralisation and CO2
rich forming fluids, although this relationship is indirect and due to
the buffering of the fluid pH in a range which enhances the solubility
of complexes of gold with reduced sulphur (Phillips, G.N. & Evans,
K.A., 2004). CO2 rich fluids are common in many gold deposit
styles, particularly the archaean deposits in the Canadian Abitibi
province and the West Australian Yilgarn province, as well as the
turbidite hosted gold deposits in Victoria, Australia, and Nova Scotia,
Canada.
In deposits formed at shallow depth, such as epithermal deposits, most of the CO2
is exsolved from the fluid before inclusion trapping occurs. Such
inclusions have low internal pressures and lack a low temperature
acoustic decrepitation peak. The decrepitation observed is from
dominantly aqueous inclusions and reflects the temperature of the
deposition from these fluids. Variations in this temperature can be
used to map out temperature gradients within the hydrothermal system as
a means of identifying zones of quartz of economic interest.
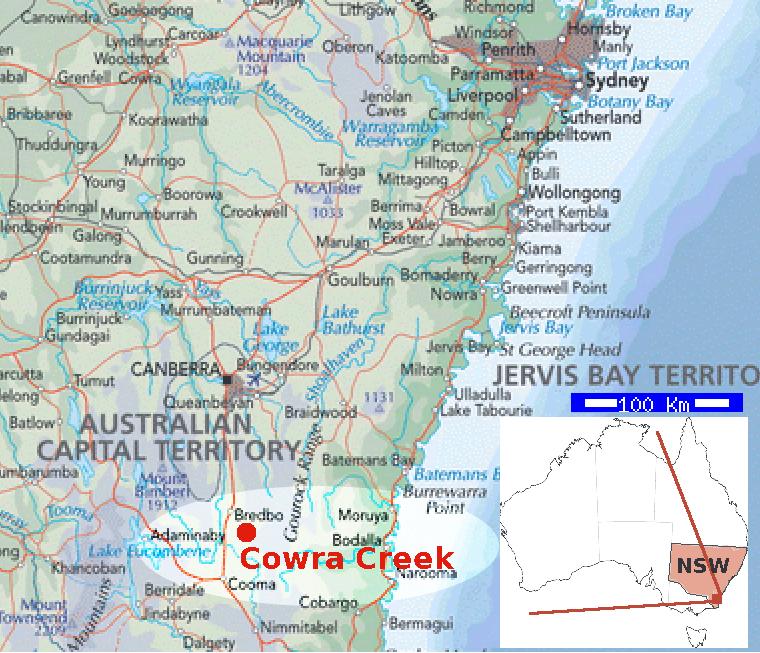
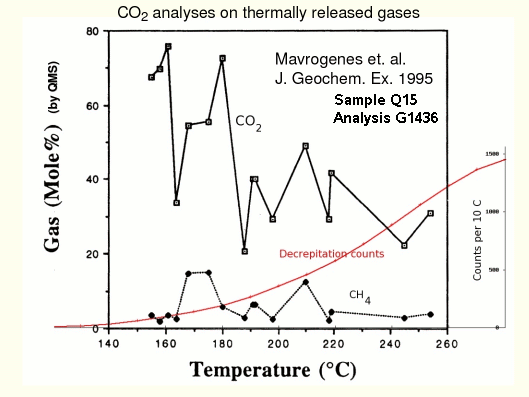
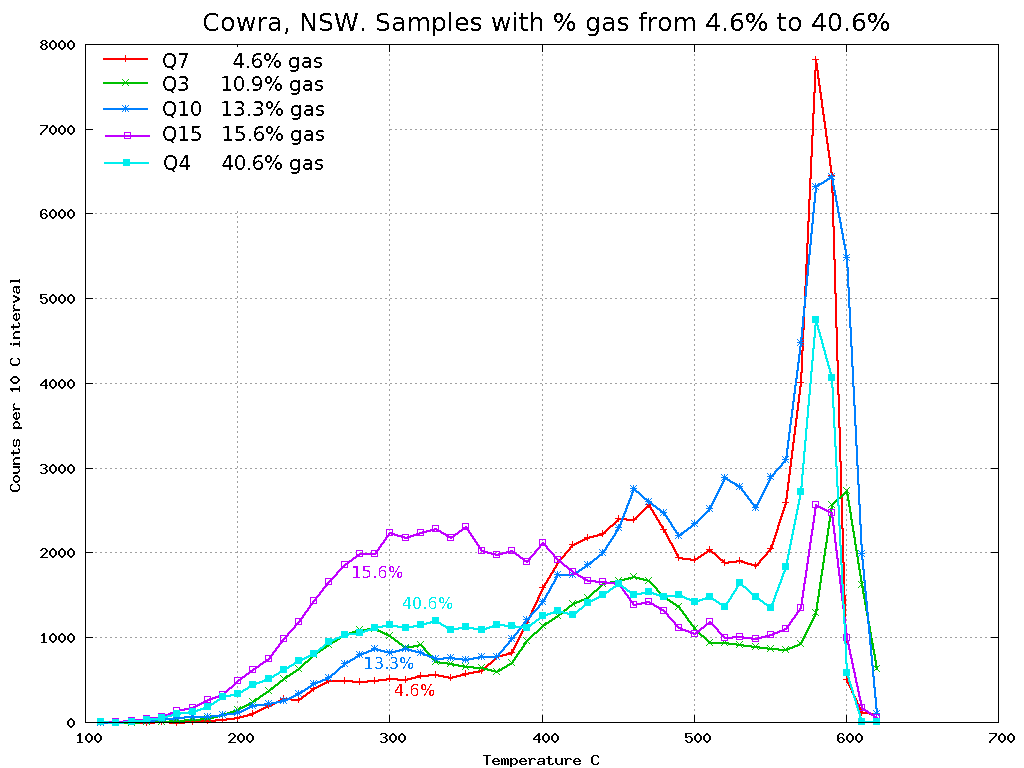
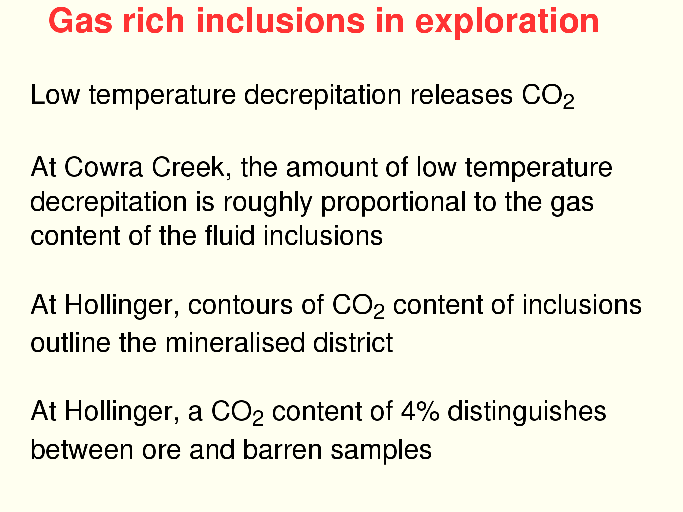
Confirmation of the relationship between low temperature decrepitation
and CO2 rich fluids was provided by Mavrogenes et al. (1995), who
performed quadrupole mass spectrometric analyses of gases released from
fluid inclusions from samples from the Cowra Creek goldfield in NSW,
Australia. In this work, 5 samples with prominent low temperature
acoustic decrepitation peaks were shown to give rise to CO2 rich gases
when the fluid inclusions were opened either by sequential heating or
mechanical crushing of the same samples.
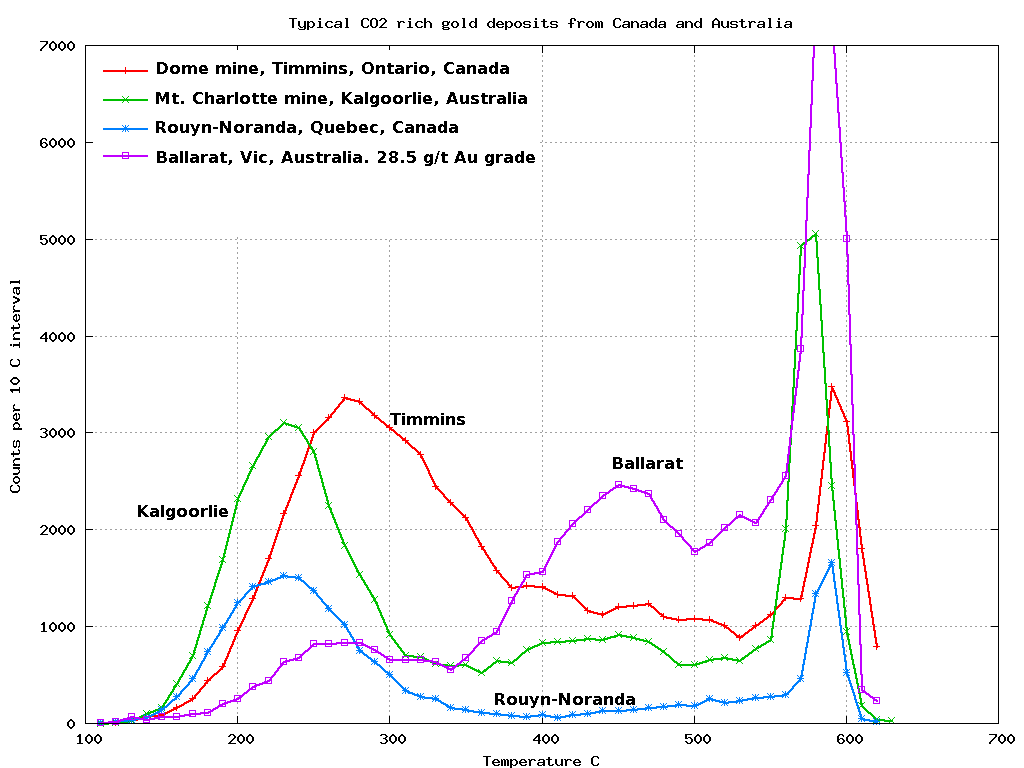
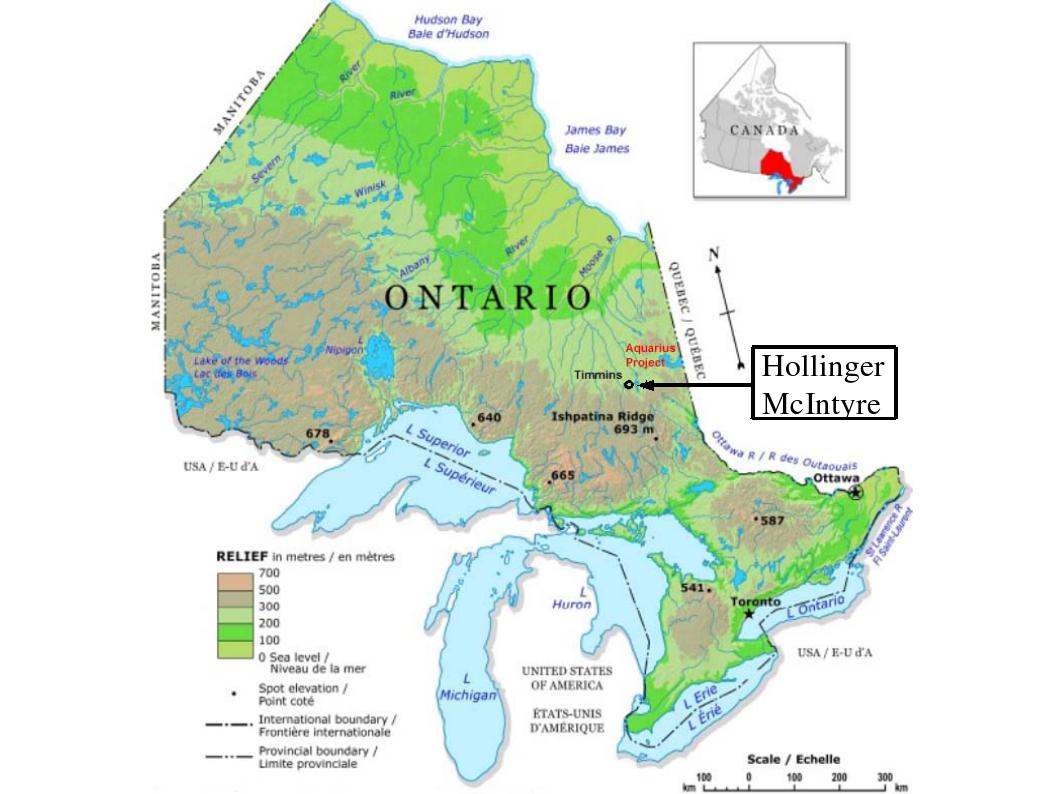
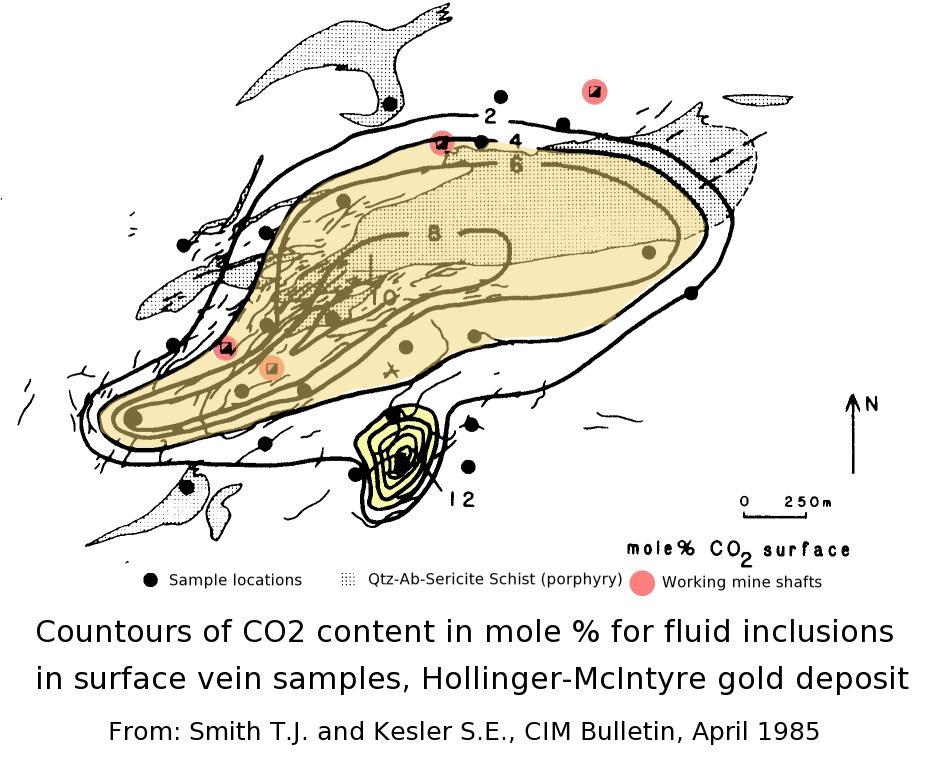
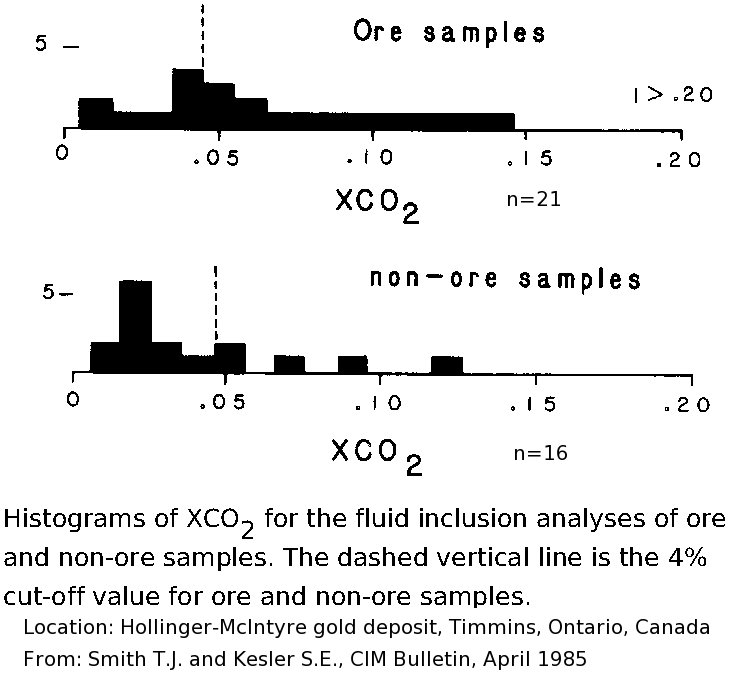
A detailed study of the Timmins, Ontario region (Smith, T.J. &
Kessler, S.E., 1985) has documented the relationship between CO2
levels and the potential for Au mineralisation in that region, showing
its use as a regional exploration indicator. Figure 2 shows typical
decrepitation results from these types of deposits and the CO2 rich
fluids are evident from the prominent acoustic decrepitation peaks
below 300 C.
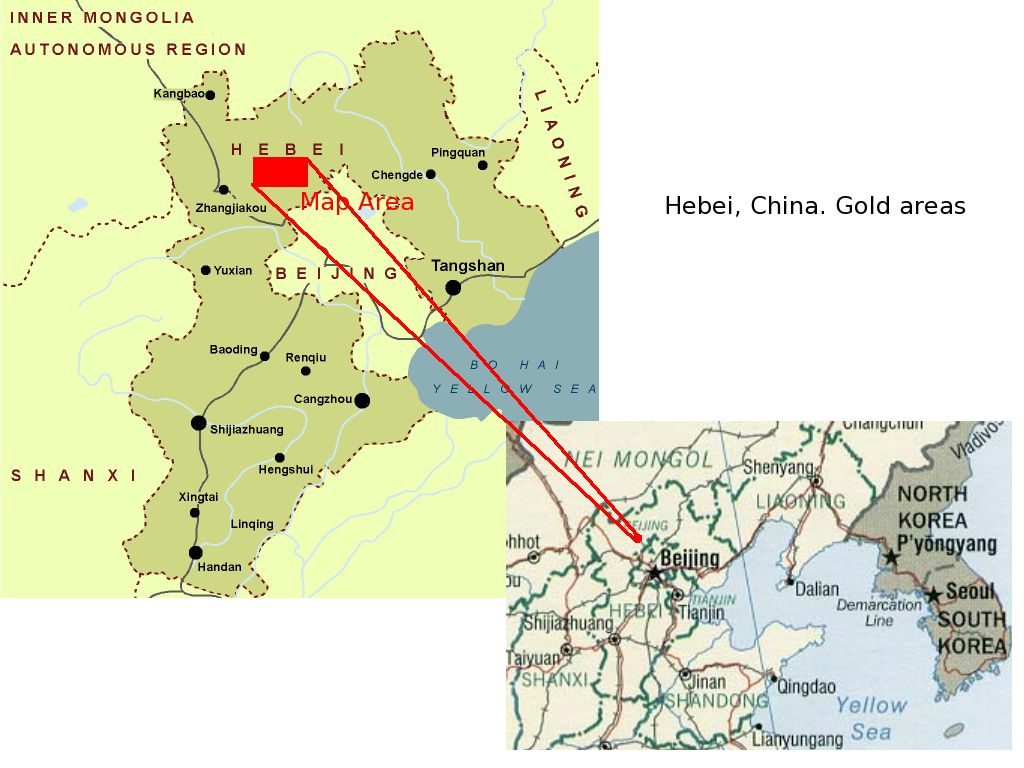
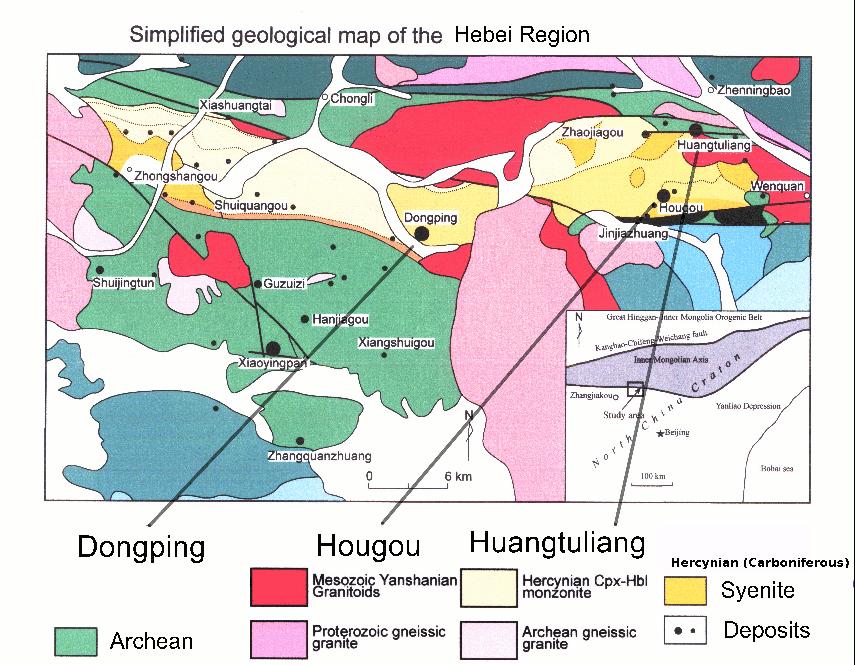
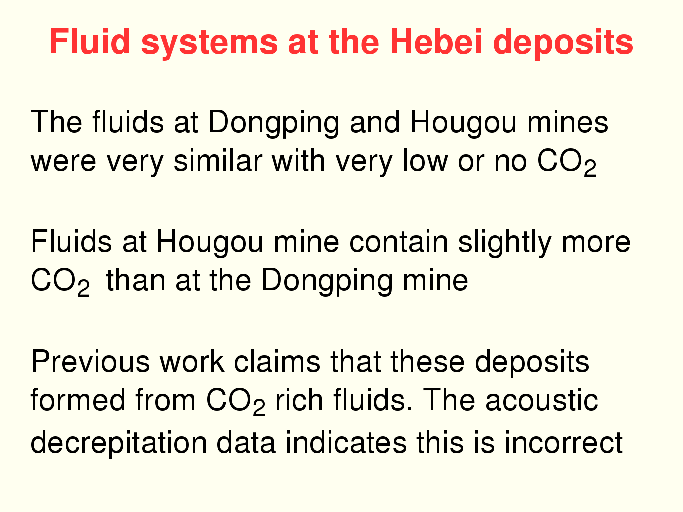
Hebei province, China
39 samples were collected from 3 mines in the Hebei province. These are
from intrusion related gold deposits in structurally controlled zones,
but despite the involvement of deep-seated fluids, only trace amounts
of low temperature decrepitation due to CO2 rich fluids were found in the Hougou mine, and no such CO2
rich fluids were identified in the Dongping or Huangtuliang mines.
Although other studies, using microthermometry, have suggested the
formational fluids at these mines were CO2 rich, the acoustic decrepitation data show that such CO2 rich fluids were volumetrically insignificant and they may not be the source of the gold mineralisation at all.
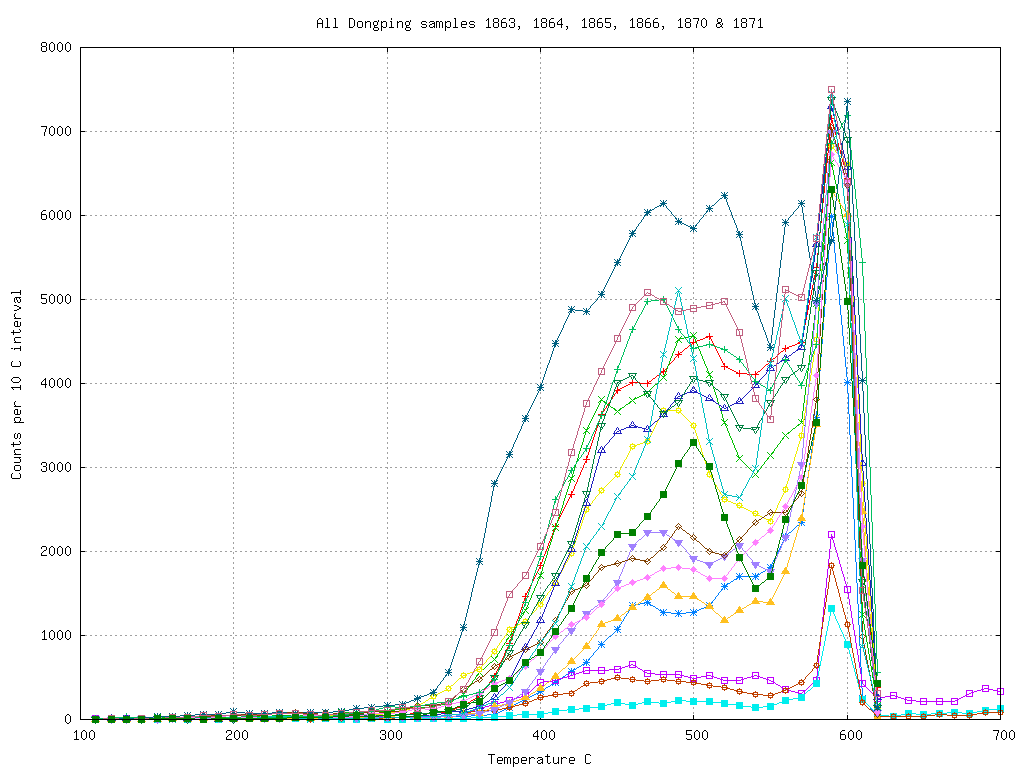
At the Dongping mine there is almost no low temperature decrepitation and hence no significant CO2 in the fluid system.
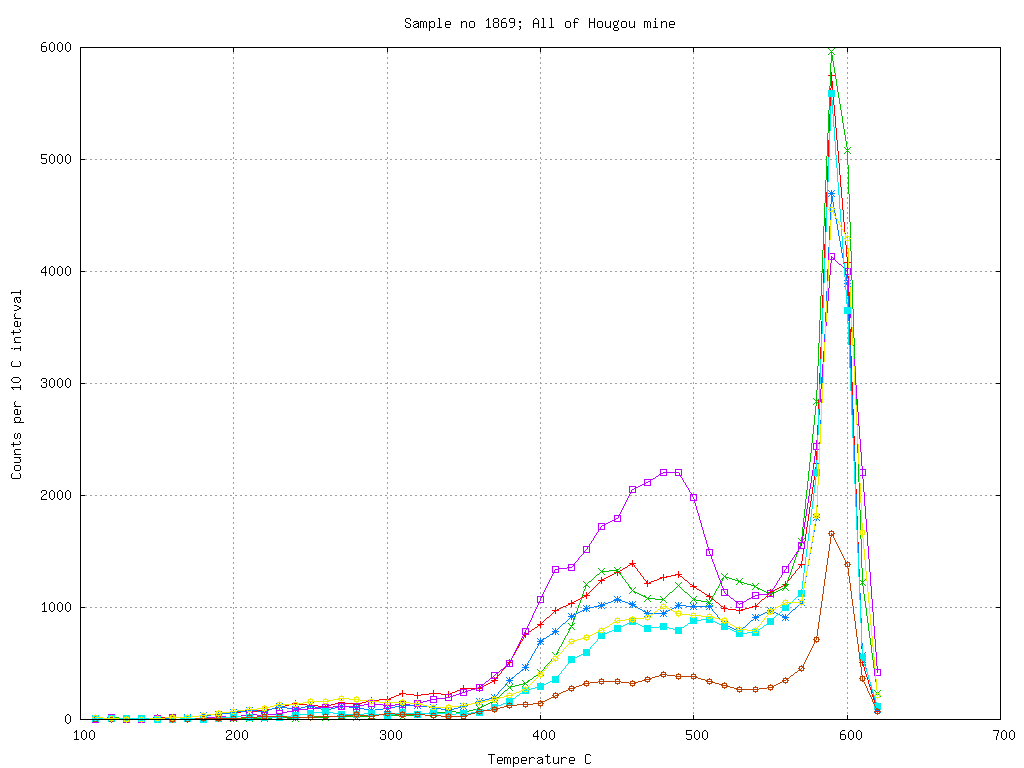
At the Hougou mine there is slight decrepitation at low temperatures indicating minor amounts of CO2 in the fluid system.
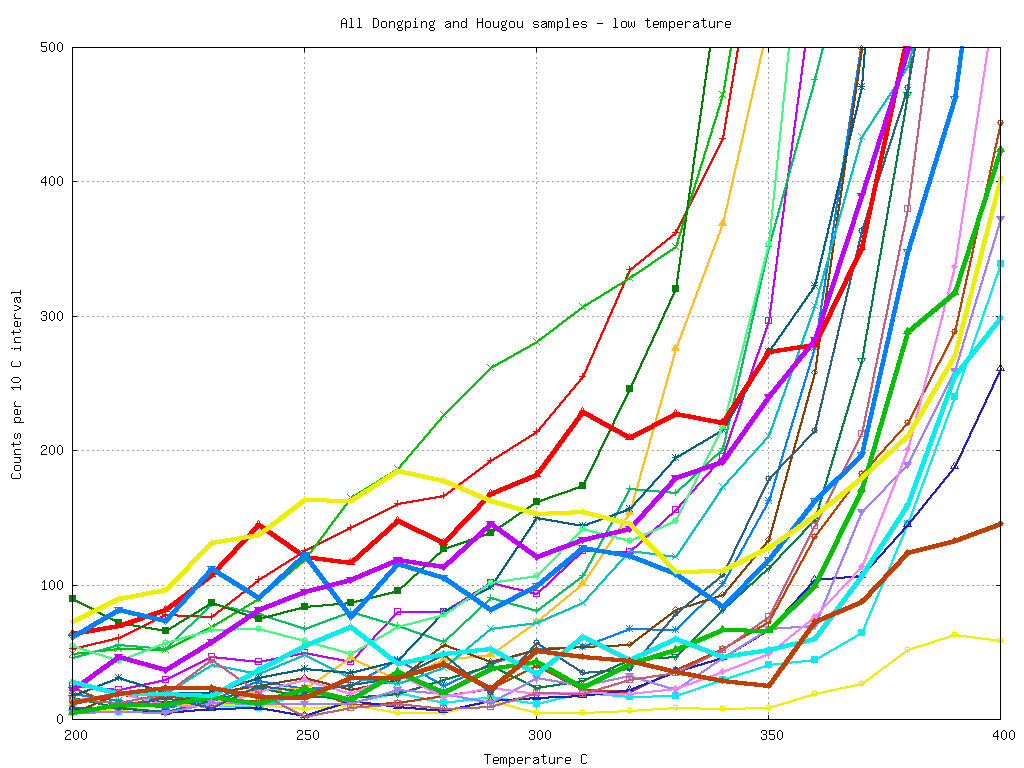
Comparing the Dongping and Hougou sample decrepitation at low
temperatures we see that the Hougou mine samples (thicker lines) tend
to have more low temperature CO2 caused decrepitation than the Dongping samples.
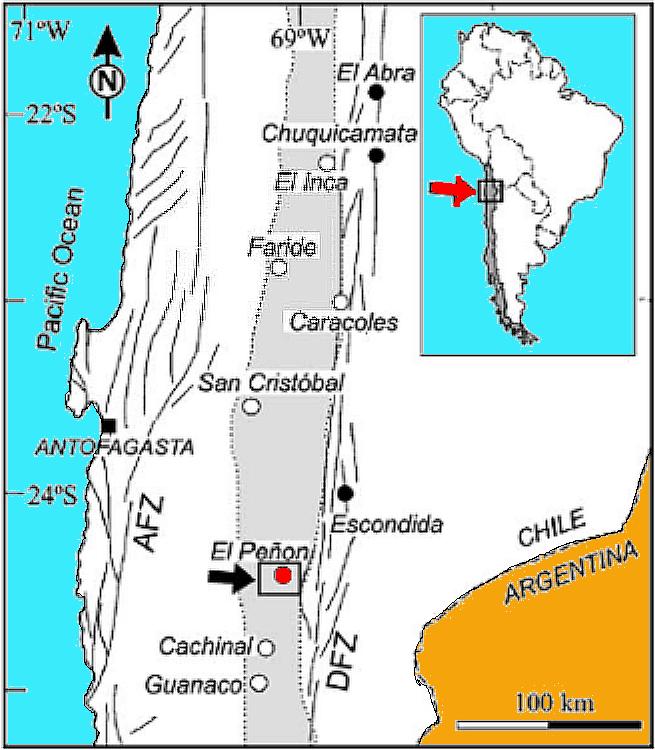
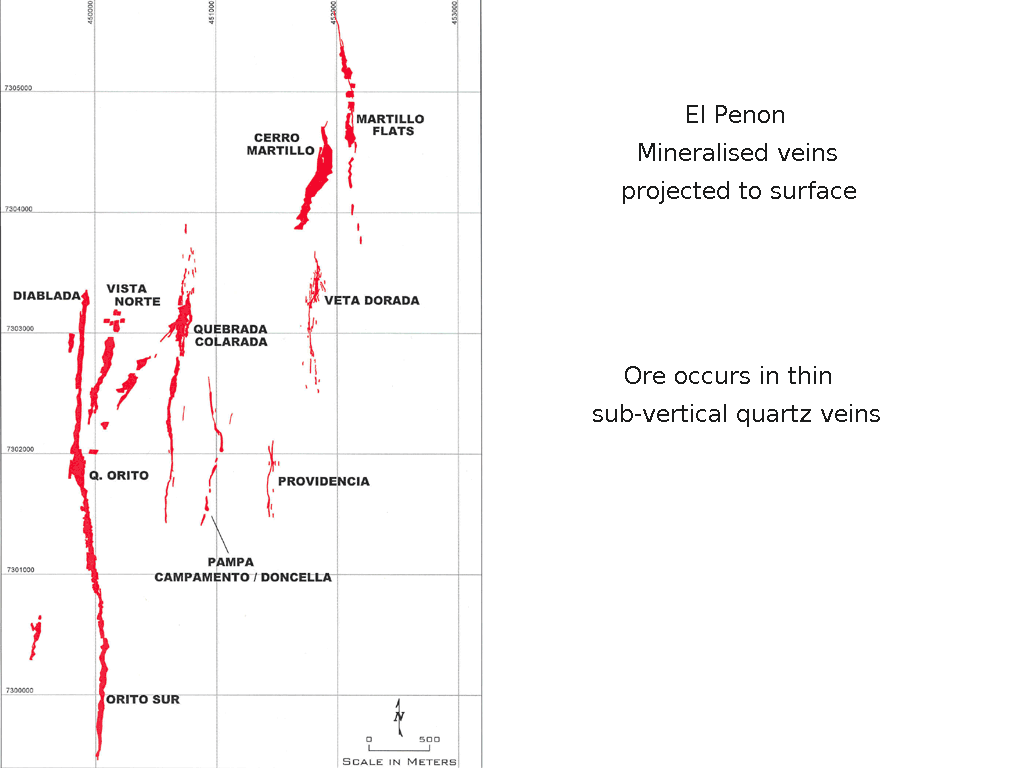
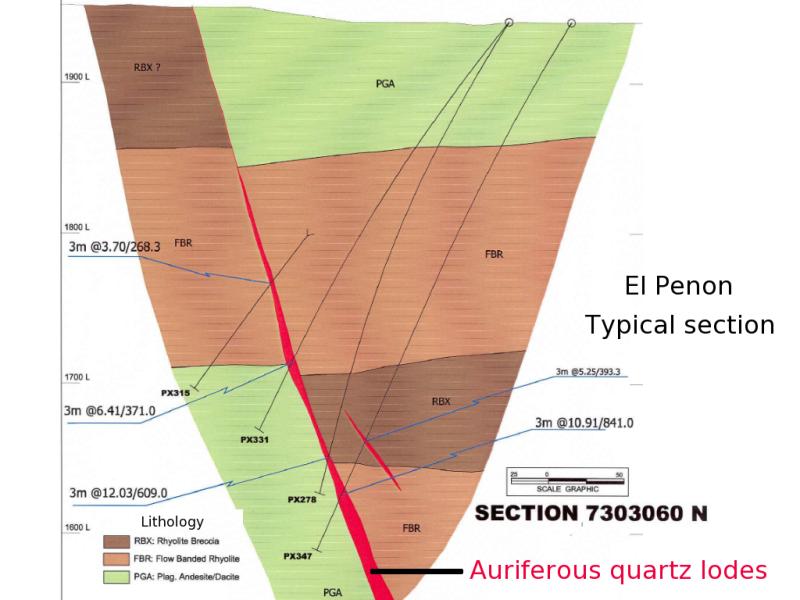
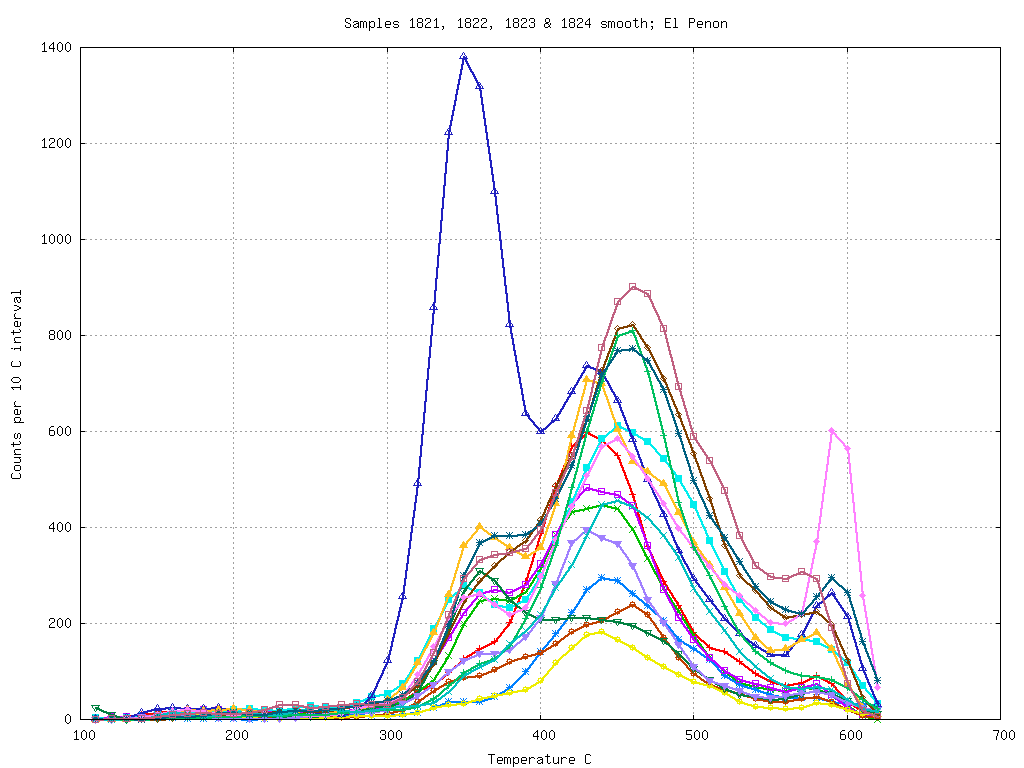
High level deposits - the El Penon mine, Chile
In deposits formed at shallow depth, such as epithermal deposits,
most of the CO2 is exsolved from the fluid before inclusion trapping
occurs. Such inclusions have low internal pressures and lack a low
temperature acoustic decrepitation peak. The decrepitation observed is
from dominantly aqueous inclusions and reflects the temperature of the
deposition from these fluids. Variations in this temperature can be
used to map out temperature gradients within the hydrothermal system as
a means of identifying zones of quartz of economic interest.
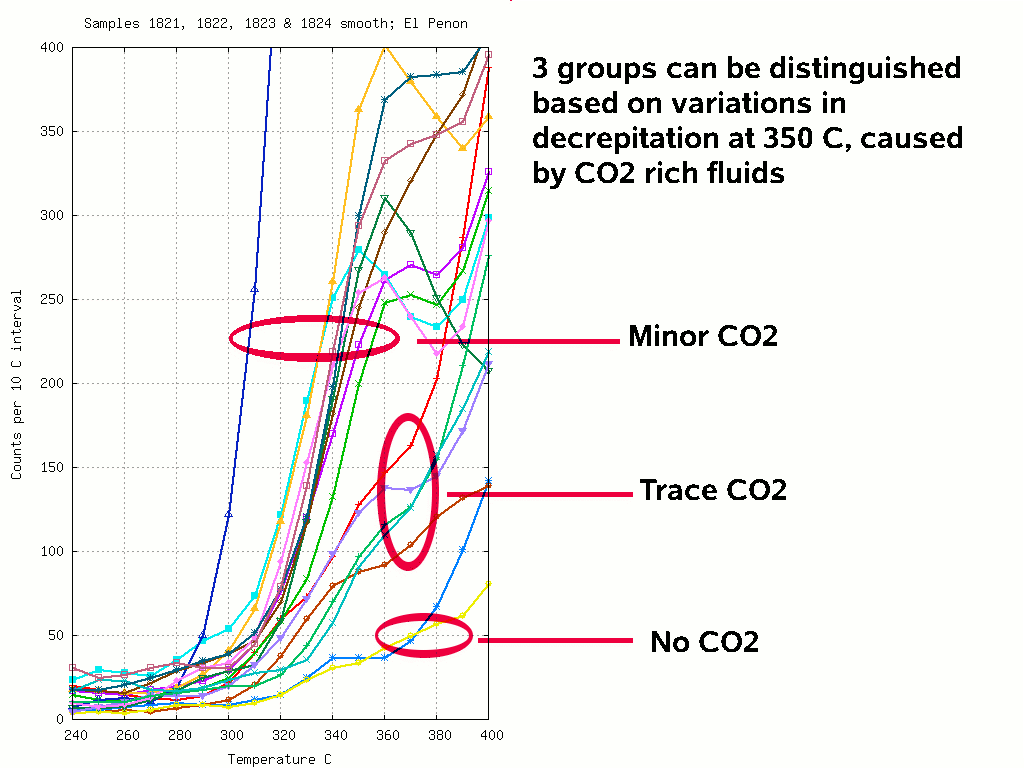
20 samples were collected from the ore and waste dumps at this mine, as
underground access was not possible. Of these, 12 samples showed a low
temperature decrepitation peak at about 350 C, which indicates the
presence of CO2 rich inclusions. The higher than usual
decrepitation temperature indicates that the inclusions had lower
internal pressures than found in typical archaean gold deposits.
Although this deposit is stated to be epithermal in origin, the
presence of CO2 rich inclusions indicates a formation depth much greater than usual.
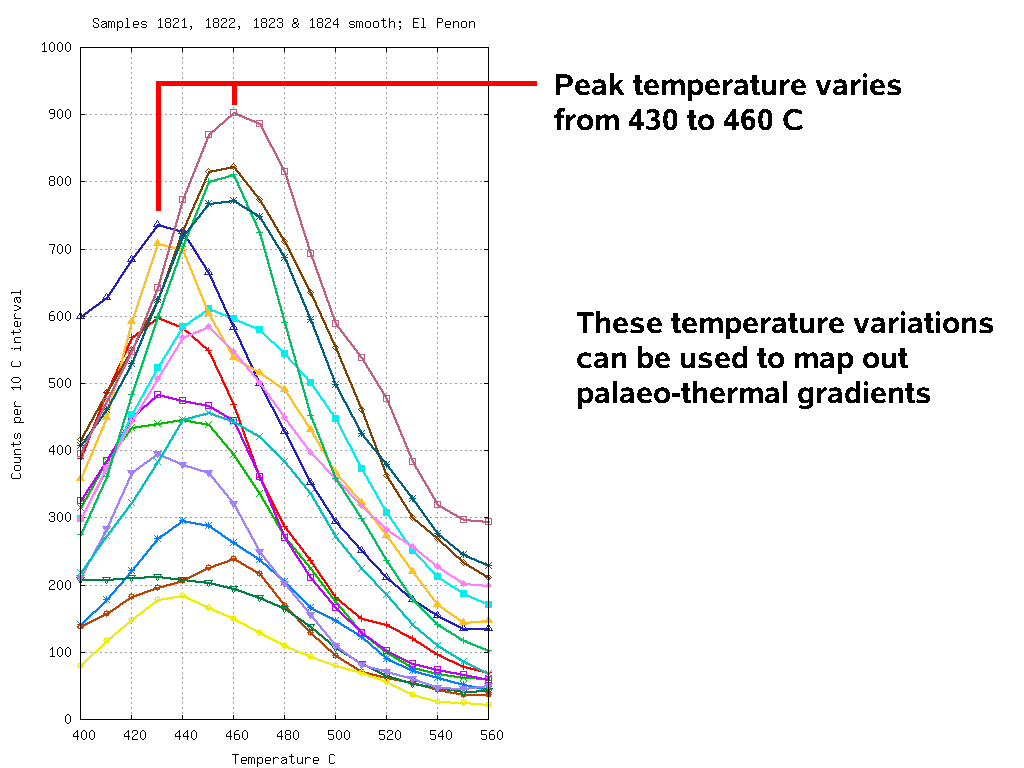
The decrepitation temperature of the main peak in these samples varies
from 430 C to 460 C showing that there are small temperature
differences within the quartz, from which it may be possible to map out
palaeo-thermal zones within the quartz, given proper spatially located
samples.
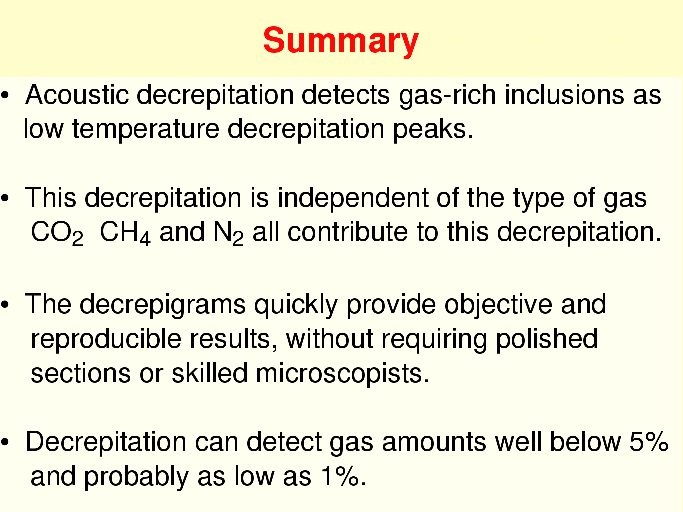
CONCLUSIONS
Acoustic decrepitation is able to detect the presence of CO2
rich fluid inclusions, due to their high internal pressures, which
results in premature decrepitation at low temperatures when heated. As
CO2 rich fluids have frequently been shown to be associated
with gold mineralisation in many districts, this means we can use
decrepitation to quickly scan large numbers of samples as an
exploration method to look for potentially mineralised quartz and to
discriminate between quartz samples which are visually
indistinguishable.
In addition, temperature variations of primary fluid inclusions can be
used to generate palaeo-thermal maps, which can be used to identify
potentially mineralised zones within quartz veins and vein systems.
Fluid inclusion information is potentially very useful in
exploration, but its use has been very limited to date because
collection of the information is tedious, inconvenient and expensive.
The acoustic decrepitation method overcomes these limitations and
provides data which is very useful in exploration, despite its accuracy
being less than that from traditional microthermometric methods.
 Applied Mineral Exploration