Newest
Topics:
For the latest news, see the NEWEST TOPICS page.
Google is too dumb to let me put the list of news in this column and falsely claims that all my pages are self-duplicates.
Google-NONSENSE
Google's so-called "Artificial Intelligence" is an abuse of the concept of intelligence!
Tests of decrepitation to discriminate between
soil samples
Potential forensic application
In October 2020 soil samples were collected from 3 separate
locations to see if decrepitation would aid in discriminating
between soil samples. This should be applicable to soils
containing quartz grains, but grains in soils may be quite
small with low decrepitation counts. Soils are a mixture of
minerals and there may be effects due to the dehydration of clay
minerals during heating or additional decrepitation from carbonate
of other mineral grains in the soil. These effects complicate the
interpretation of fluid inclusions in the sample, but may actually
help to characterize soils and facilitate the discrimination of
soils from different locations.
Location map of the 3 soil samples tested
The Litchfield sample (number 2069) was collected within an area
of quartzose outcrop of the Depot creek formation sandstone of
middle Proterozoic age on a residual plateau. It is 83 Km from the
Mcminns sample.
The McMinns samples (numbers 2070, 2072, 2073) are from the
laboratory location in an area of Cainozoic age lateritic soil,
probably over Mesozoic siltstone/sandstone sediments and there is
no nearby outcrop.
The Burrell sample (number 2071) is over outcrop of Burrell creek
formation or Koolpin formation siltstone of early Proterozoic age.
It is 8 Km from the Mcminns sample.
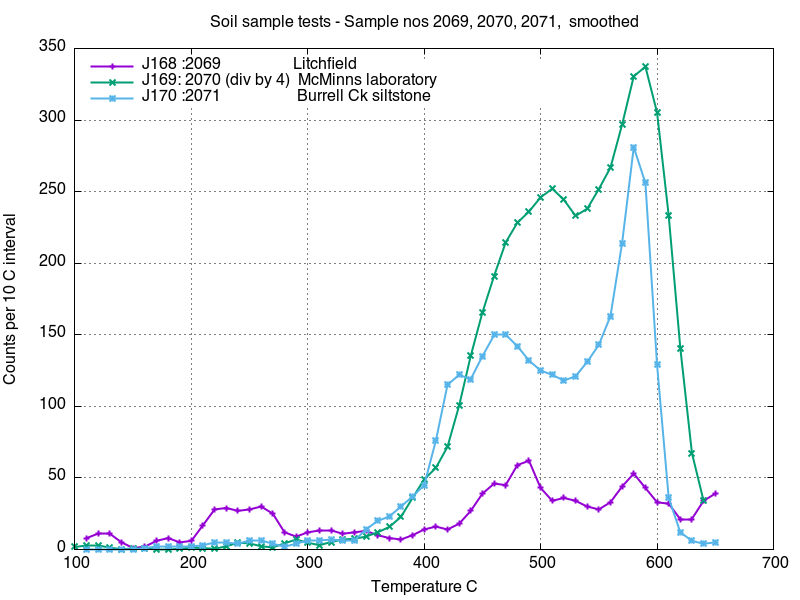
Compare-contrast 3 unrelated samples
All 3 of the soil samples were collected over quartzose
sedimentary rocks but from mutally distant locations and over very
different age parent rocks. All of these samples have been
subjected to intense lateritic weathering with abundant
ferruginous nodules in the Mcminns samples 2070, 2072 & 2073.
The samples were sieved and 0.5 grams of the <420, >200
micron size fraction was analysed. The plotted results are
weighted rolling mean smoothed over 3 samples at 25%, 50%, 25%
weights. Note that sample 2070 had much more intense decrepitation
and has been divided by 4 or 8 for convenient comparison with the
other samples.
There are significant differences between these samples in both
their decrepitation temperature pattern and decrepitation
intensity. Normally it would be best to distinguish samples based
on their temperature profiles, but the significant differences in
decrepitation intensity between these 3 samples is probably also a
defining characteristic, although likely to be influenced to some
degree by variations in the quartz to clay percentages in the
sample. Clay minerals do not usually give a decrepitation
response, but may do so if they dehydrate or decompose. The low
temperature decrepitation between 200 and 300 C of sample 2069 is
characteristic of CO2 rich fluid inclusions within
quartz grains. The near absence of the quartz alpha-beta inversion
peak at 580-590 C on this sample 2069 is also unusual and
distinctive. Samples 2070 and 2071 show quite different
temperature patterns with dual peaks at 430 and 465 C on sample
2071 and an almost single peak at 510 C on sample 2070.
It is also possible to use curve fitting to discern the component
sub-populations which make up these complex curves as in many examples
on this website and also here.
Using the deconvolution data would assist in discriminating
between or identifying identical samples.
It is clear that these 3 soil samples are mutually quite distinct
and readily distinguished by decrepitation analysis. NOTE:
subsequent tests suggest that sample 2070 is contaminated and a better plot of samples from
these 3 locations is below using sample 2072 instead.
Initial sample comparison plot
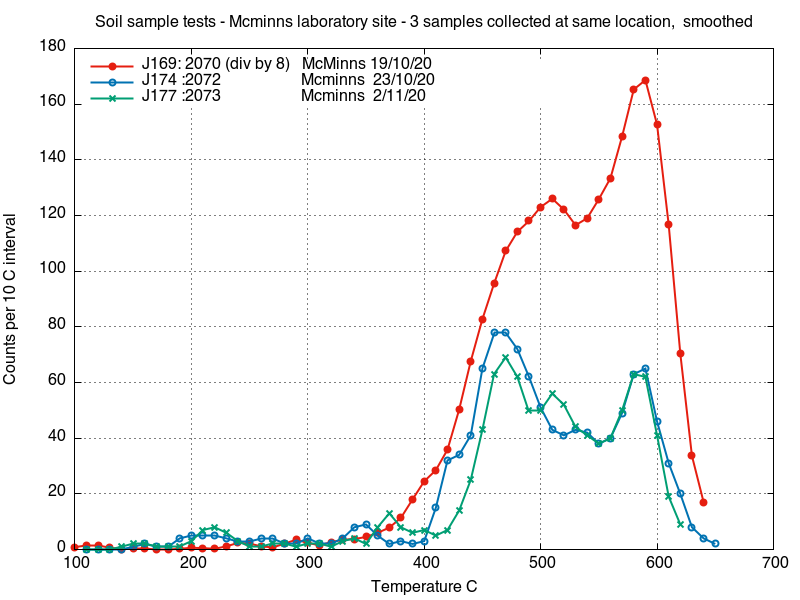
Testing the sampling reproducibility for multiple samples
collected at a single location, within 10 metres distance.
Sample 2072 was collected at the McMinns laboratory some 2 metres
from the original sample 2070. These 2 results were surprisingly
different, so a third sample 2073 was also collected at the
McMinns laboratory some 10 metres from sample 2070. The
decrepitation of samples 2072 and 2073 are very similar to each
other, but both different from sample 2070. It is possible
that sample 2070 was contaminated with sand left after
construction activities some 30 years ago.
The results from the 3 separate samples collected at the McMinns
laboratory show that samples 2072 and 2073 are a close match, but
sample 2070 is very different.
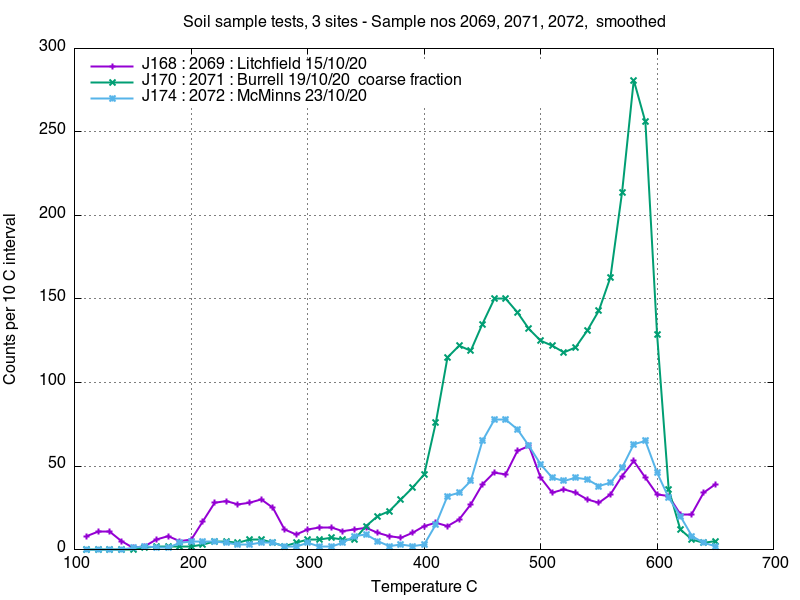
Preferred sample comparison plot after collecting additional
replicate samples.
This preferred comparison of decrepitation of soil from 3
locations in NT shows sample 2072 instead of (possibly
contaminated) sample 2070 at the McMinns laboratory location.
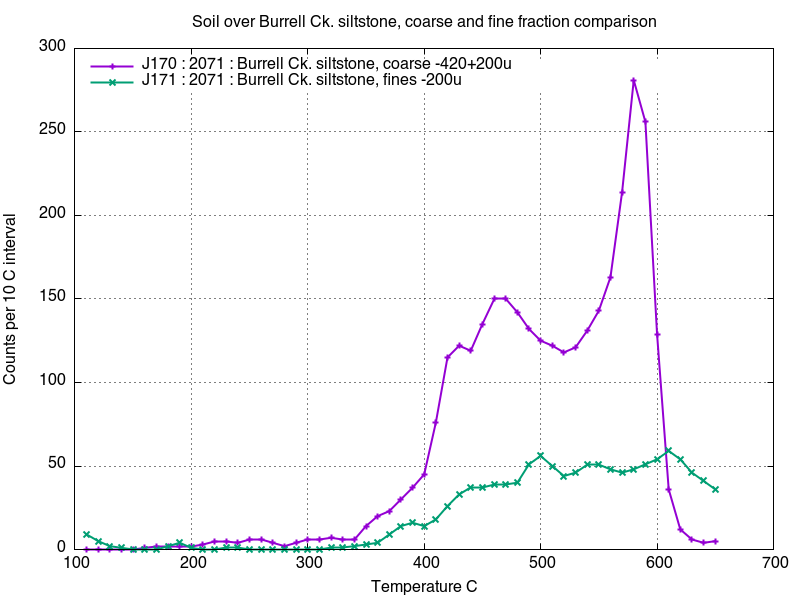
The effect of grainsize on analyses of the same sample
Two different grainsize fractions of sample 2071 were analysed.
This sample was dominated by fine grains with only some 20%
exceeding 200 microns. The analysis of the fine grained fraction
was done on 1.0 gram of sample as only low decrepitation was
anticipated. It is likely that the fine fraction was mostly clay,
as indicated by the absence of the distinctive quartz alpha-beta
peak at 580 C on the fine grainsize fraction. Although both
fractions start to decrepitate at 400 C, the grainsize effect
prevents identification of these 2 results as being part of the
same original sample.
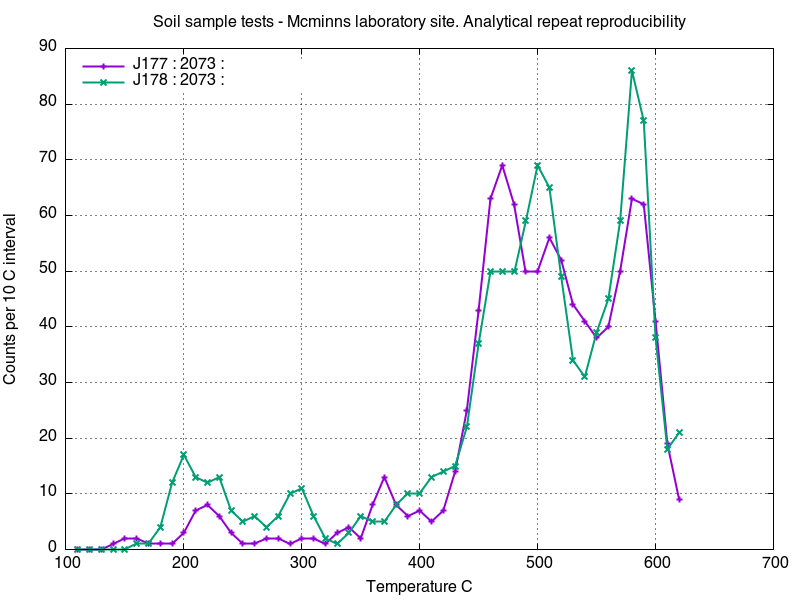
Test of analytical reproducibility
The McMinns laboratory sample 2073 was analysed twice on
subsequent days to examine the repeatability of analyses. These 2
analyses are a good match. Because of the low decrepitation counts
on this sample, better results would be obtained by using a larger
1.0 gram sample - or perhaps even 2.0 grams.
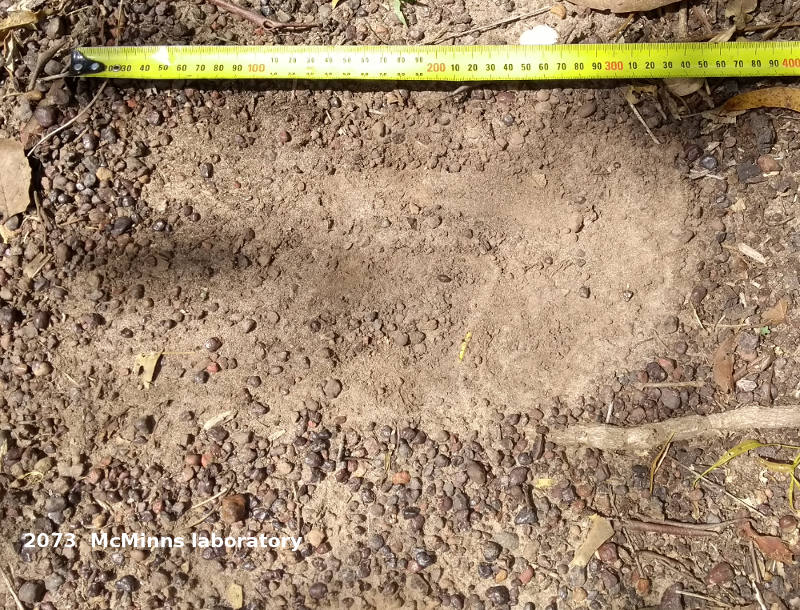
Soil sample 2073 collected at the McMinns laboratory was of a
nodular furruginous lag soil over quartzose sediments with no nearby
outcrop, photographed here. The sample came from the scraped area.
Summary
This brief preliminary study shows that
decrepitation of soil samples is capable of discriminating
between samples and may be useful for forensic purposes.
However because soils are a mixture of mineral phases there
can be unexpected variations which may either interfere or
contribute to identification of similarity or difference
between samples. There is good between-sample reproducibilty
for multiple samples collected at the same location and also
good analytical reproducibility of the same sample on multiple
days. Further studies of soil decrepitation would be helpful
to better understand the reliability of soil sample
identifications. Curve deconvolution as seen elsewhere
on this website would probably assist in differentiating or
confirming the similarity of samples.
 Applied Mineral Exploration