Applied mineral exploration methods, hydrothermal fluids, baro-acoustic decrepitation, CO2 rich fluids
Newest Topics:
For the latest news, see the NEWEST TOPICS page.


Google is too dumb to let me put the list of news in this column and falsely claims that all my pages are self-duplicates.


Google-NONSENSE


Google's so-called "Artificial Intelligence" is an abuse of the concept of intelligence!

The Woods Point gold deposit, Victoria, Australia


Overview:

A selection of quartz samples from the Morning Star mine and environs were analysed by baro-acoustic decrepitation as part of a project carried out by Caitlyn Hoggart and supervised by Reid Keays of Monash University.

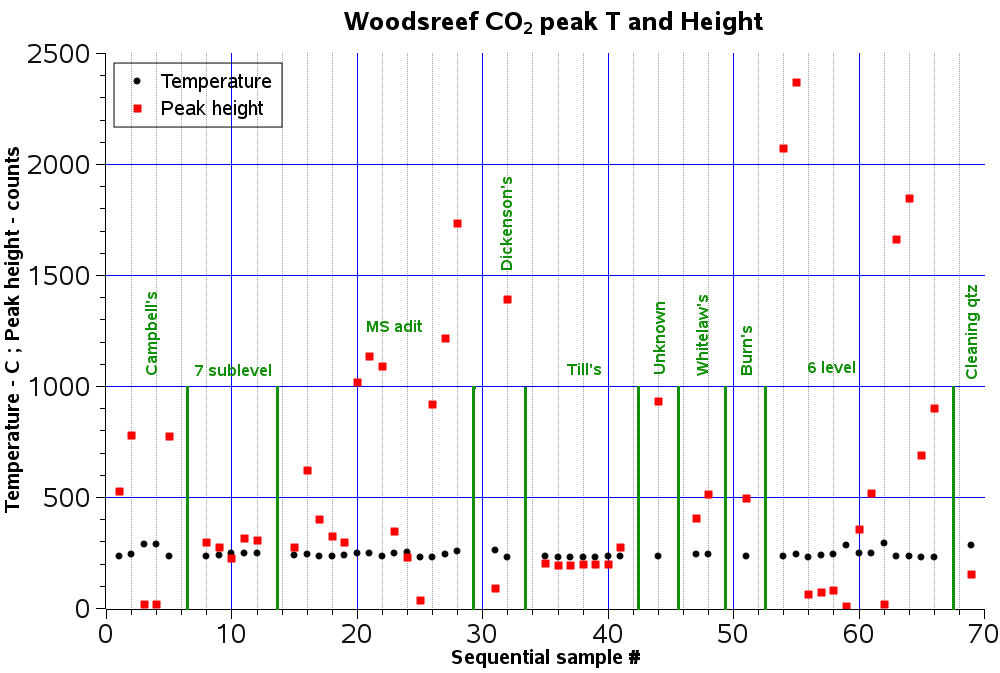
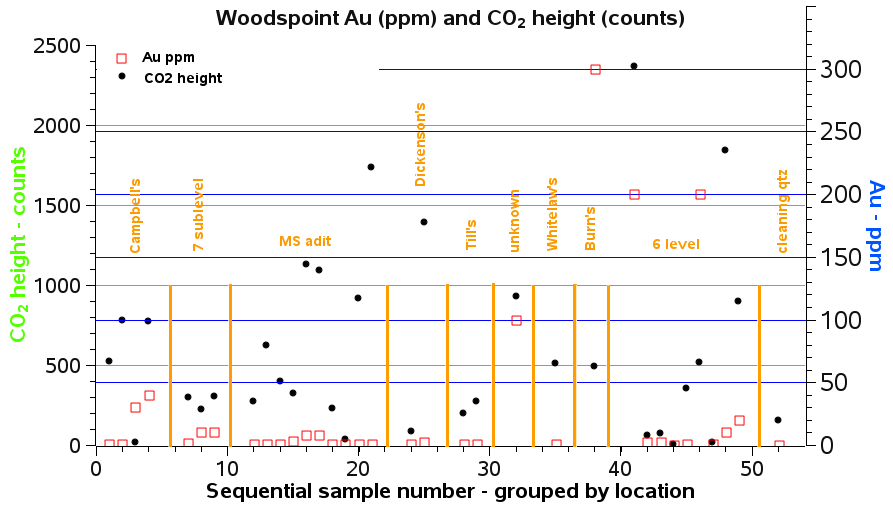
The decrepitation data showed that the auriferous hydrothermal fluids which formed the deposit typically contained very high quantities of CO2. Decrepitation is a rapid and simple method to estimate the CO2 contents of the ore forming fluids and this method would be useful in exploring for extensions to the existing deposits or in finding new deposits in this region by identifying quartz formed from these CO2 rich, potentially auriferous fluids..


Geology and Location:

The Woods Point mine is located 120 km NE of Melbourne and has produced some 900,000 oz of gold. It occurs in a dyke swarm hosted within Devonian sandstones and shales. The dyke rocks are of granophyre, peridotite, diorite and gabbro and the gold occurs within quartz  and quartz/carbonate veins within the dykes. For a thorough overview of the geology see: Nature of gold mineralisation in the Walhalla Goldfield, southeast Australia by M.A. Hough, F.P. Bierlein, L. Ailleres & S. McKnight,Aust. Jnl. of Earth Sciences, 2010, V57, pp 969-992.

regional geology map
Simplified geology map of central Victoria showing major faults and the extent of Palaeozoic metasedimentary and metavolcanic rocks. (After F.P. Bierlein, D.C. Arne, D.A.Foster & P. Reynolds, Mineralium Deposita V36, p741-767, 2001.)


woods point geology map
Geological map of the eastern Melbourne Zone, showing the distribution of individual dykes within the Woods Point dyke swarm and principal geological and structural features. (After Phillips & Hughes, 1996; Bierlein et al 2001.)


Discussion:

34 quartz samples from the Woods Point region were analysed by baro-acoustic decrepitation to determine the relationship between decrepitation response and known mineralisation as well as to examine the variability of the results within and between different types of quartz.

A prominent feature of most of the sample results is the presence of a decrepitation peak at low temperature, around 250 C. This peak is caused by the presence of large quantities of incondensable gases in the fluid inclusions. This is usually caused by the presence of CO2, with CH4 and N2 being less common additional gases.

The graph below shows the results from 9 samples collected in the Morning Star adit. All of these samples show a low temperature CO2 decrepitation peak ranging in intensity from substantial to extreme. The Morning Star mine was the largest in the Woods point area and confirms the strong relationship between Au mineralisation and CO2 rich fluids. The decrepitation data from all the samples shows that CO2 rich fluids were common throughout this area. The complete set of results is shown here.

morning star adit data


To compare the histograms of the samples, de-convolution was carried out to resolve them into individual skewed gaussian component populations. From 3 to 8 component populations were found depending on the sample. The result of a typical deconvolution, in this case of sample 511 from the Morning Star adit, is shown in the graph below. In this graph the original data is shown in black, and the mathematically derived sum of individual populations is shown in red. These two graphs are in good agreement. The 5 individual gaussian component populations are also shown as gaussian_2 to gaussian_6. The parameters of the component populations are recorded during the de-convolution and can be used in semi-quantitative comparisons between the samples. This is much more precise than merely trying to visually compare the decrepigrams in a suite of samples. The curve fitting results of selected samples is shown here.


h2303 sample 511 5 population fit


Using the data from the curve fitting, the graph below shows the central temperature of the low temperature CO2 peak together with the height of that peak. The height of this peak (red squares) is an approximate estimator for the quantity of CO2 present in the fluid that formed the quartz sample concerned. this graph includes some additional results from replicate analyses and duplicate de-convolution calculations. Many, although not all, samples show high levels of CO2. A compilation plot of all the fit data is shown here.

co2 and height plot


Gold analyses were provided by Caitlyn for all except 2 samples. It is not clear how these Au analyses were obtained and it seems that they are estimated values based on nearby samples rather than direct analyses of the exact samples which were sent for decrepitation analysis. Nor is it known what analytical technique was used to measure the Au. Despite this uncertainty, the data plotted below show an interesting correlation between the Au analysis and the height of the low-temperature (CO2 - caused) decrepitation peak. All of the samples (with 1 exception) which contain 10ppm or more of Au show high CO2 peak heights. Many additional samples with low Au contents also show high CO2 peak heights. This is to be expected as the fluid characteristics of a hydrothermal system provide a much larger anomaly halo around mineralization than does the mineralization itself. This provides a bigger and more homogeneous exploration target than trying to use Au analyses as a geochemical exploration method. The Au analyses are also prone to erratic variations due to inhomogeneous distribution and the nugget effect during sampling and analysis. In addition, the use of Au estimates rather than direct analyses on the same sample would introduce further variation.

All of the samples, except for the "cleaning quartz" for which there is no Au analysis, were collected from mineralized quartz occurrences or actual working mines. Unfortunately, there are no confirmed unmineralised samples in the sample suite to provide a comparison between mineralised and barren quartz. It is suspected that barren samples would show low or no CO2 peak as is the case with the cleaning quartz, which is presumed to have no measurable Au content.


co2 and au data

Conclusions:

The quartz samples from the Woods Point mineralization occurrences have low temperature decrepitation peaks which are caused by the presence of substantial amounts of CO2 in the fluids which deposited the quartz vein and gold mineralisation. Samples with high gold contents also have high CO2 decrepitation peaks and it is clear that the presence of CO2 rich fluids would be an effective exploration method to explore for extensions of the known deposits or to explore for additional new deposits in the region. Because the distribution of CO2 rich fluids is wider and more homogeneous than the distribution of Au itself, it is advantageous to use CO2 analyses in exploration because of the larger and more consistent target size of CO2 anomalies.


Back to the Baro-acoustic decrepitation index