ABSTRACT (
abbreviated)
Zonation patters are well developed in the mafic metavolcanic rocks
that host epigenetic quartz-carbonate-gold vein mineralisation at the
Hollinger-McIntyre deposit.
.......
Lithogeochemical zoning is equally well developed as variations in whole-rock abundances of As, Au, Ba, Rb and Sb.
As and Ba form the most useful zonation patterns, outlining individual ore zones as well as broader trends of mineralisation.
Gas chromatographic analyses of fluid inclusions in the quartz-carbonate veins indicate that the mineralising fluid was an H
2O-CO
2 mixture. Locally, CH
4-rich
fluid inclusions are associated with graphitic and/or carbonaceous
wallrocks. Fluid inclusions in ore-bearing veins have higher CO
2
contents than those in non-ore veins. Extensive sampling and analyses
of the veins from the area surrounding the deposit reveals a well
developed zonation of CO
2 contents about the main zone of mineralisation. Low CO
2 levels (1-2 mole%) in veins are peripheral to the deposit and increase to over 12 mole% in mineralised zones.
The observed zonation of the carbonate alteration assemblages is the result of CO
2 addition to the wallrock, which is consistent with the zoning of CO
2 in the fluid inclusions.
The zoning patterns delineated in this study are useful in exploration
both on a deposit scale and on the scale of individual ore zones.
..........
FLUID INCLUSION ZONATION
.......
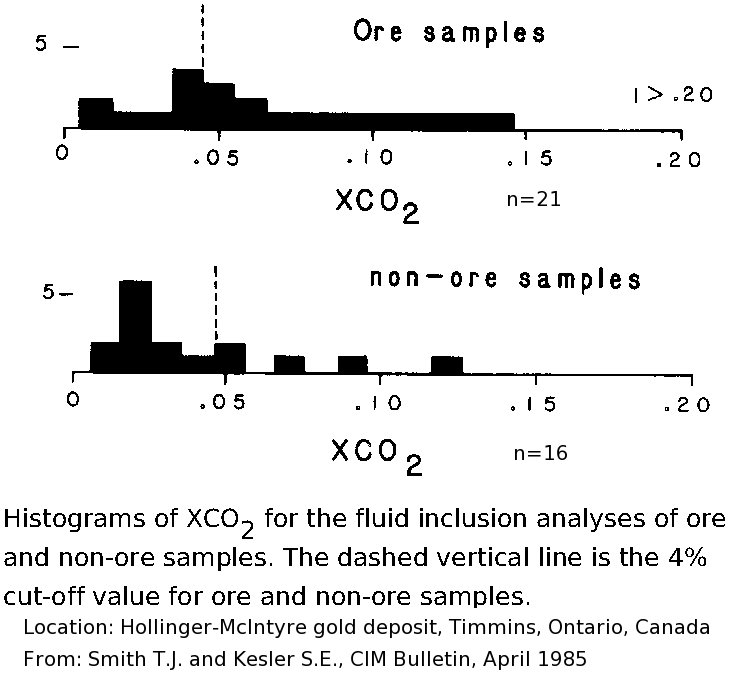
The amount of CO
2 in the samples effectively distinguishes between ore and non-ore samples. In general, ore samples have group 1 (CO
2 rich) compositions, whereas non-ore samples have group 2 (low CO
2) compositions (Fig. 20)(
below). With a cutoff value of 4% CO
2
approximately 83% of the ore samples would be identified as anomalous.
The distinction is not as accurate for the non-ore sample group where
64% of the samples have CO
2 contents below 4 mole %.
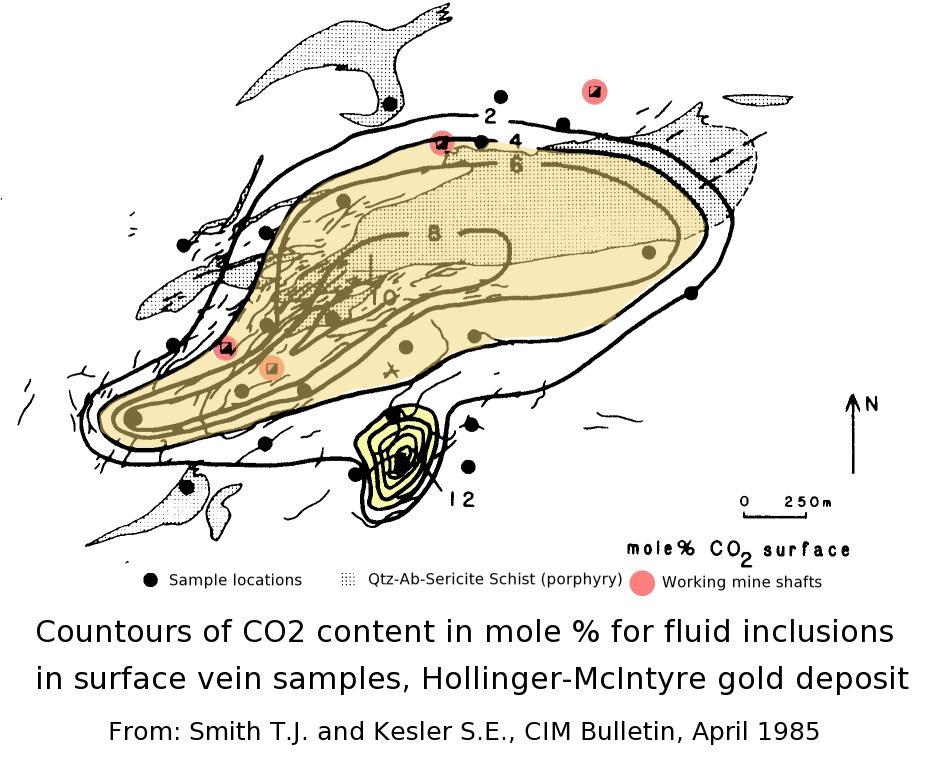
CO
2 levels in the fluid inclusions show distinct zoning relationships to the mineralisation. Figure 21 (
below) shows contours of mole % CO
2 for the surface vein-quartz samples. Low CO
2
values of 1% to 2% surround the mine area and increase to values of
over 12 % in the mineralised zones on the Hollinger property. It is
interesting to note that high CO
2 values show a good
correlation with the distribution of the intensely carbonatised
Assemblage IV rocks. Lower values tend to be found in veins in less
altered rocks. Careful examination of the fluid inclusions shows that
the high CO
2 values observed in our analyses reflect actual CO
2-rich compositions rather than contamination from carbonate minerals.
.........
Application of Zoning to Exploration
.......
CO
2 levels in fluid inclusions in quartz veins in areas
peripheral to mineralised areas are low, less than 4 mole %, whereas
values of 4 % and above are restricted to areas of ore-grade
mineralisation. Samples with significant amounts of CH
4 (greater than 2 mole %) are associated with wallrocks of graphite or carbonaceous material.The distinction in terms of CO
2
content between ore and non-ore samples still holds for these graphite
samples. Obviously this method can only be applied to rocks which
contain quartz veins and is most useful in exploration on an ore-zone
scale, in evaluating the gold potential of individual veins within a
larger vein system.
Back to the Hydrothermal fluids page
Back to the Main Contents
 Applied Mineral Exploration