In 2013, samples from Krivoy
Rog and Darwin were exchanged and analysed on both the
Russian decrepitometer and the
BGS model 105 instrument.
Both instruments measure pressure changes resulting from
the decrepitation of fluid inclusions in the sample, but the
russian instrument measures total pressure during decrepitation
in a vacuum, while the BGS model 105 instrument measures
acoustic frequency pressure pulses in air at room pressure.
The Russian instrument results are provided as a list of
temperatures and pressure readings. It seems that the
measurements are taken at fixed time intervals and the period is
not specified but seems to be about 5 seconds. The units of the
pressure measurements are not specified.
Following an initial review of the data, a plot of the furnace
temperate heating rate was prepared by plotting the temperature
increase during each 5 second sampling period. This showed that
there were significant problems with both the temperature
measurement system and the furnace heating control system of the
russian instrument.
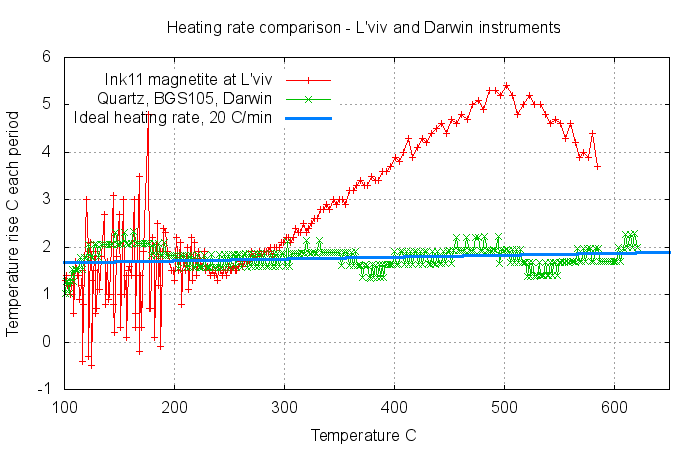
The red graph shows extreme temperature fluctuations at low
temperature, probably due to a bad thermocouple system, and also
extreme non-linearity and inaccuracy of the heating rate of the
sample. This is a serious design problem as variations in the
heating rate will affect the decrepitation data.
For comparison, the heating rate for the BGS model 105
instrument is shown in green. This shows a well controlled and
constant rate of temperature increase throughout the analysis of
about 1.7 degrees Celsius per 5 second interval, or 20 degrees
Celsius per minute.
The blue line shows a perfect constant heating rate of 20 C per
minute. (It is not exactly horizontal because of non-linearity
in the temperature measurement probe.)
At the BGS laboratory, a standard sample of Howley quartz has
been used for analytical quality control since 1984. An aliquot
of this material was sent to L'viv for analysis on the russian
instrument, and the result was compared with an analysis on the
BGS model 105 instrument.
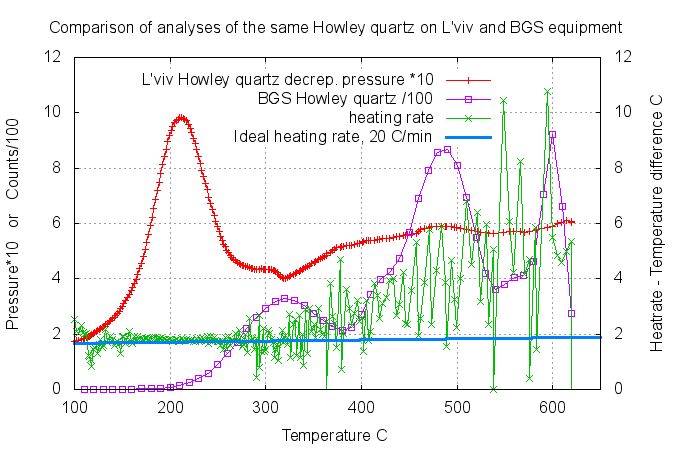
The result in red (from the russian instrument) bears no
relation to the result in magenta (from the BGS model 105
instrument). The intense peak at 200 C on the russian instrument
is a concern and perhaps this is due to desorption of water on
the sample rather than to fluid inclusion decrepitation. The
absence of peaks at 500 and 600 C may be because the inclusions
are small and hence do not contribute significantly to the
absolute pressure of the russian instrument when they burst
open. But the BGS instrument counts individual pressure pulses
and is little affected by the volume of the inclusions.
The green graph shows the heating rate of the russian instrument
during this analysis. Once again there is random noise in the
temperature system, but also lack of heating rate control above
350 C. This excessive heating rate might be causing the gradual
rise in decrepitation above 350 C on the russian instrument.
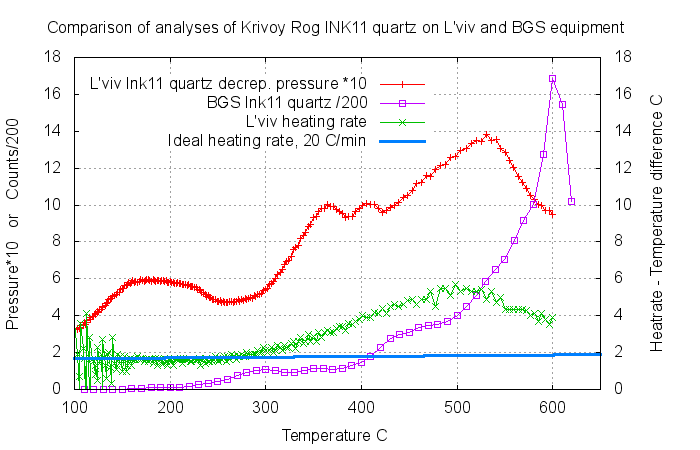
Samples from the Krivoy Rog mine in Ukraine (sample Ink11) were
also analysed on both instruments. The 2 aliquots were not
completely identical splits of the same rock and there may be a
small sample variation between these 2 samples. Once again there
is almost no correlation between the results on the 2
instruments. The peak below 200 C on the russian instrument
(shown in red) may be due to water desorption. The heating rate
of the russian instrument, shown in green, is again improperly
controlled above 300 C. This excessive heating rate seems to be
at least partially, if not substantially, causing the rise in
decrepitation up to 550 C and its decrease from 550 C to 600 C
on the russian result.
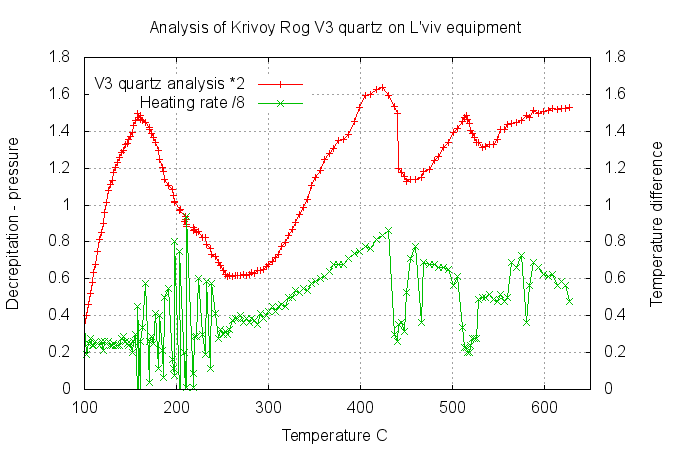
The following sample of quartz from Krivoy Rog (sample V3) was
also analysed at L'viv on the russian equipment. The pressure
result in red was accepted without question and interpreted into
5 temperature ranges:
| 1)
75-160˚С |
| 2)
210-225˚С |
3)
265-425˚С 370-387°C kurtosis
|
| 4)
460-515˚C |
| 5)
540-631˚C |
But when the heating rate is plotted (green curve) it is clear
that these decrepitation peaks are caused by the severe
irregularities in the furnace heating rate. This result, which
is typical of many russian decrepitation analyses, must be
regarded as completely spurious and caused by dysfunctional
analytical equipment.
The result is not due to fluid
inclusions in the sample at all.
The quartz in sample V3 was also analysed on the BGS instrument
and is shown in red on this graph.
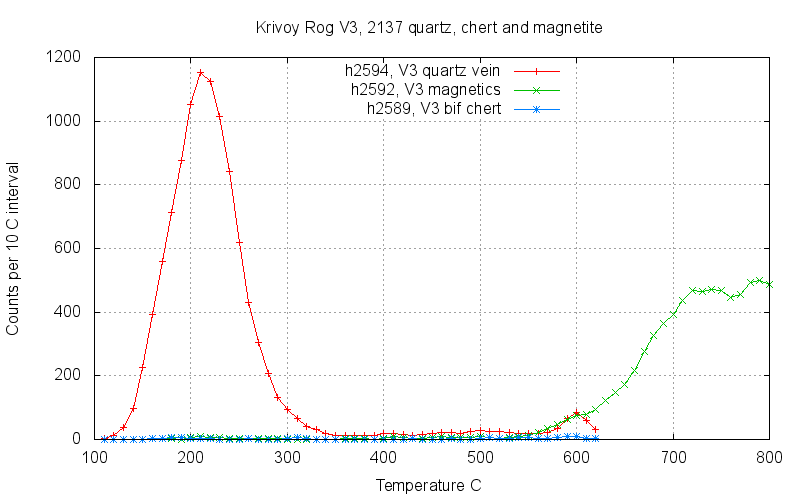
The prominent decrepitation peak near 200 C is seen on the
results from both instruments. This peak is caused by CO
2
rich fluid inclusions. But there is no decrepitation at
higher temperatures on the BGS result. The decrepitation peaks
at 400 C, 500 C and 600 C on the russian instrument result seem
to be merely caused by the extremely bad heating rate
control of the furnace and erratic temperature measurements and
are geologically meaningless.
Conclusions
The results from the
russian
decrepitometer in Lviv do not match the results on the
same sample using the BGS model 105 decrepitometer in Darwin.
This is in contrast to the
good
match in results between the chinese decrepitometer in
Beijing and the BGS model 105 decrepitometer in Darwin.
There are significant instrumental issues with the Russian
instrument, which does not have adequate control over the
heating rate and suffers from variable random noise in its
temperature measurements.
The inadequate heating rate control seems to be a design problem
and probably affects all the results from this type of
instrument. Analyses of other samples often show strange peaks
in decrepitation such as in sample V3 above, which are clearly
correlated with erratic heating rate of the sample.
Decrepitation analyses carried out on these instruments cannot
be trusted and almost certainly show spurious peaks which are
not a feature of the fluid inclusions in the sample, but are
instead an instrumental artifact of the inadequate heating
mechanism of these instruments.
The spurious results often reported from these russian
instruments has caused people to assume the decrepitation method
does not work. This conclusion is incorrect and unfortunate
because the problem is in fact due to this particular
instrument, which does not work properly.
Results from these
instruments should not be accepted.
Other decrepitation instruments do produce consistent
decrepitation data which is solely caused by fluid inclusions
in the samples. The decrepitation technique does work well
when using properly designed equipment.
 Applied Mineral Exploration