Newest
Topics:
For the latest news, see the NEWEST TOPICS page.
Google is too dumb to let me put the list of news in this column and falsely claims that all my pages are self-duplicates.
Google-NONSENSE
Google's so-called "Artificial Intelligence" is an abuse of the concept of intelligence!
Decrepigram Interpretation Guide
Introduction
These brief notes are intended as a
basic guide to the interpretation of decrepitation surveys.
They are not a complete guide as this would require that the
user be familiar with many aspects of heating stage microscope
techniques and also have an understanding of the various types
of fluid systems responsible for forming ore deposits.
However, they should enable the user to begin to exploit the
information recorded in fluid inclusions as an exploration
tool.
General
The decrepigram is a histogram of
pressure pulses occurring in intervals of 10`C rise in
temperature of the sample. This 10`C temperature rise takes 30
seconds at the usual 20`C per minute heating rate. The
decrepigram shows the characteristic temperatures at which a
sample decrepitates, the abundance of decrepitations and often
also shows the presence of multiple, seperate populations of
inclusions in a sample. The features of relevance in an
interpretation are:-
The number of peaks present.
The temperatures at which
these peaks occur.
The magnitudes of the peaks.
The widths of the peaks.
For interpretation purposes the temperature of a decrepigram peak
can be read at it's maximum or at it's toe, i.e. the base of the
steep front slope of the peak. (This may have to be interpolated
back to the baseline.) The temperature at the maximum has no real
physical meaning and is used empirically in comparison between
samples within a geologically meaningful suite. Despite its
arbitrary nature, this temperature is the easiest to measure and
usually the most useful in an interpretation.
The temperature at the toe of the peak (the "onset temperature",
meaning the onset of massive decrepitation) can, in some cases, be
an accurate measure of the homogenization temperatures of the fluid
inclusions and thus a guide to the actual mineral formation
temperature. In other cases a correction of -70` to -20`C applied to
the temperature at the peak of the decrepigram gives a reasonable
approximation to the homogenisation temperature. In a study of quartz from the
Kingsgate Mo-Bi mine in NSW, Hladky & Wilkins concluded
that "the heating stage homogenization temperature data and
decrepitation data for fluid inclusions are closely correlated". In
addition they derived a simple correction procedure to estimate the
approximate mean homogenization temperature from the mean
decrepitation temperature. (They deduct about 75 from the
temperature of the decrepitation peak.) These methods only apply to
dominantly liquid phase inclusions with low CO2 contents.
The reasons for this are well documented in the fluid inclusion
literature and also explained here. Suffice it
to say that unless you have associated petrographic data it is
unwise to assume that a decrepitation temperature is actually the
mineral formation temperature, but a reasonable estimate of the
formation temperature can be deduced from the decrepitation data.
The decrepitation data is best interpreted empirically by noting the
temperature variations within a geologically and/or spatially
related sample suite. The decrepitation temperature variations
reflect changes in the fluid temperatures and compositions across
the suite, although the absolute temperatures may not be meaningful.
The results indicate the presence of anomalies in a suite of
samples, the lack of absolute temperatures being of no consequence
in an exploration situation using a properly selected suite of
samples. Variations in the height (magnitude) of the decrepigram
peaks are of less use in interpretation than are the temperature
variations, as events which postdate quartz formation may erase some
inclusions by annealing or grain boundary movement during
recrystallization. But primary features such as the inclusion size
distribution and initial abundances of fluid inclusions are also
reflected in the sizes of the decrepitation peaks and may be
important in the interpretation. Sample descriptions should note the
degree of recrystallization (often giving a very granular texture to
quartz) to assist in interpreting changes in the magnitudes of the
decrepigram peaks.
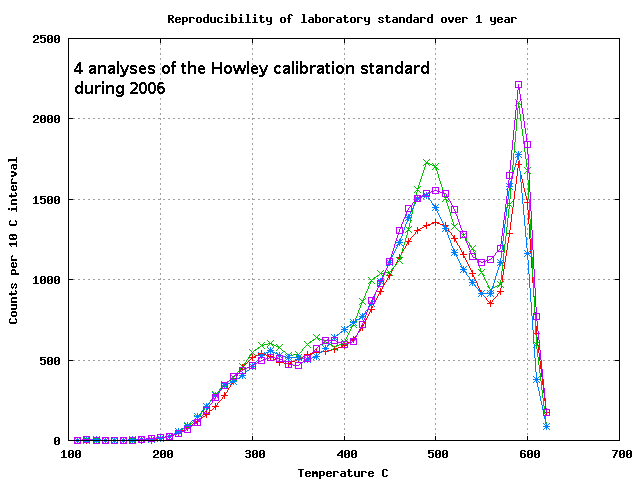
Instrument
reproducibility considerations
For quality control of the decrepitation results, a standard sample
is analysed each day and compared with the archive of previous
results. A very large quantity of crushed and sieved quartz from a
proterozoic gold deposit near Darwin was prepared many years ago to
use as this long term calibration standard. The sample was selected
because it contains a modest level of CO2 rich fluid
inclusions which decrepitate near 300 C. In addition unusual
samples are occasionally analysed twice, and background blank levels
are checked by re-analysing material which has already been
analysed. Repeated analyses of the same sample show that the
decrepigram reproducibility is one histogram interval (10`C) and 10%
in amplitude of the peaks. Hence the minimum meaningful temperature
difference is 10-20`C.
Samples are considered to show meaningful decrepitation when the
decrepigram shows one or more distinct peaks, which are almost
always of the classical Gaussian distribution shape. Samples which
show only widely scattered or uniform decrepitation across a wide
temperature range should be rejected when measuring temperatures.
(Note, however, that the absence of decrepitation may itself be a
meaningful feature of a sample and be of significance in an
interpretation when the finer points of natural fluid systems are
considered. This is beyond the scope of these notes.)
If you are attempting to relate the decrepitation data with heating
stage work it is of note that secondary inclusions don't seem to
give a decrepitation response. It is suspected that the pressure
levels of bursting secondary inclusions are too low to be detected,
but the reason for this is not yet completely clear. The instrument
automatically changes the plotting scale of the decrepigram to
ensure it fits on the paper. The scale factors are binary multiples
and the value used is printed on each decrepigram. Should you wish
to rescale a decrepigram, the actual data is tabulated on each one
just above the plot.
Quartz samples
Quartz is particularly well suited to decrepitation studies and is
by far the most common type of sample used. It is resistant to
weathering, brittle and often transparent enough to be amenable to
concomitant microscope studies. As many as 3 distinct decrepitation
peaks commonly occur in quartz samples. A low temperature peak
(onset at 200`C or less, maximum at 200-300`C) is caused by the presence of CO2 rich
fluids in the inclusions. This peak corresponds to the
presence of a visible liquid CO2 phase in microscope
work. The CO2 gives rise to rapidly rising pressures in
the inclusions, resulting in decrepitation at relatively low
temperatures. (In fact, often below the temperature of
homogenization.) Shifts in the temperature of this peak probably
relate to variations in the partial pressure of CO2 in
the inclusions. (Don't confuse CO2 and carbonate.
Carbonate accessory minerals in the system do not necessarily imply
a high CO2 level in the fluids, and vice versa.) Note
that this peak can be distinct even in samples with just 4 mole
percent CO2 content.
A medium temperature peak (onset 300-450`C, maximum 350-550`C) is a
very common feature of quartz samples. It is not clear exactly what
types of fluid inclusions cause this almost ubiquitous peak. This
peak is the most useful when looking for temperature variations
within a system.
A high temperature peak (onset about 540`C, peak 570-580`C) is
commonly, but not always present. This peak is indirectly related to the alpha
- beta phase transition of quartz which occurs at 573`C. Note
carefully that the transition does not give rise to a decrepigram
peak on its own accord, but only in concert with fluid inclusion
decrepitation. Just before this temperature the Young's modulus
(mechanical strength) of quartz decreases , suddenly returning to
normal above this temperature. This reduction in strength
facilitates the decrepitation of any inclusions present, giving rise
to this peak, which is always at the same temperature (almost - it
can vary a bit), but of quite variable magnitude. Above this
temperature, the renewed strength of the quartz positively inhibits
further decrepitation and a pronounced temperature interval of low
activity occurs. (If your samples show decrepitation above this
temperature, then they weren't monomineralic quartz!) This peak is
of limited usefulness in an interpretation and is probably caused by
very small inclusions. Because little or no decrepitation occurs
above this temperature, quartz samples are normally only heated up
to 620`C.
Other minerals
The interpretation procedures when using other minerals are
gererally the same. Lacking the phase inversion at 573`C which
occurs in quartz, most other minerals can be usefully heated to
800`C. (The maximum capability of the instrument.) Feldspars,
carbonates, pyrite, magnetite and haematite are the most commonly
used other minerals to date. Many sulphide minerals give distinctive
peaks which may confuse the interpretation of samples in which they
are present only as minor impurities. At higher temperatures they
start to oxidize, which makes noise and gives rise to a decrepigram
peak unrelated to fluid inclusions. Sulphides are generally only
heated to about 600`C to avoid this problem.
Carbonates give rise to very distinctive decrepigrams. These usually
have a peak beginning about 300`C, with a maximum from 350-550`C and
a tail up to 700`C or so. They almost always decrepitate violently
(grains often fly 15 to 20 cms. away), giving a peak of great
magnitude. Most carbonates plot at scale factors of 32 or 64 and
produce some 6000 counts in a 10`C temperature interval. The failure
to show a pronounced decrease in decrepitation above 580`C assists
in recognizing carbonate samples. If the dominant sampling phase is
quartz, even small quantities of carbonate can swamp the quartz
response and render the result uninterpretable. It is not exactly
clear why carbonates decrepitate in this manner. Because carbonates
are ductile, theoretically they should not decrepitate, or at best,
the temperatures of decrepitation should be poorly related to their
formation temperatures. However, carbonate samples do show
significant differences between themselves, and these differences
can be used in an interpretation of a suite of such samples. In some
cases the carbonates decompose pyrolotically below 800`C and
observation of this temperature may also be useful in an
interpretation.
Factors influencing decrepitation
Decrepitation of a fluid inclusion depends on a complex combination
of factors including the following:-
Homogenization temperature of
the inclusion, related to formation temperature
Physical size of the inclusion
(Very small ones may not decrepitate at all)
Fluid composition - presence
of CO2, degree of salinity.
Host mineral strength and
ductility.
Inclusion degree of fill -
Vapour rich inclusions probably never decrepitate
Physical shape - angular
inclusions stress at corners and decrepitate easier
Despite the complexities involved in the theoretical understanding
of the decrepitation process, case histories show that the data
obtained can often make a significant contribution to an exploration
program.
 Applied Mineral Exploration