Newest
Topics:
For the latest news, see the NEWEST TOPICS page.
Google is too dumb to let me put the list of news in this column and falsely claims that all my pages are self-duplicates.
Google-NONSENSE
Google's so-called "Artificial Intelligence" is an abuse of the concept of intelligence!
Selecting the best grainsize for decrepitation
analyses
Decrepitation analyses are carried out on crushed grains,
preferably monomineralic. The optimum sample grainsize depends on
the fluid inclusion sizes and the host mineral. Several samples
have been analysed on multiple size fractions to ascertain the
most suitable grainsize to use for routine analyses. Grainsizes of
-1100+600 microns (-20+30 mesh/inch), -600+420 microns (-30+40
mesh/inch), -420+200 microns (-40+80 mesh/inch) and <200
microns (<80 mesh/inch) have been analysed on several different
minerals to determine the best size fraction to use. Coarse
grainsize samples tend to give erratic (noisy) decrepigrams
probably because only fluid inclusions near the grain surfaces
decrepitate. Very fine grainsize samples give very low
decrepitation levels, probably because many fluid inclusions are
destroyed during sample crushing. The preferred grainsize for
decrepitation analyses was selected to be the -420+200 micron
fraction. The following graphs show the decrepitation results of
each of these 4 grainsizes on 2 samples of quartz, 2 samples of
andesite and one sample of dolomite. In the andesite samples, the
fluid inclusions are probably hosted in feldspars.
Quartz
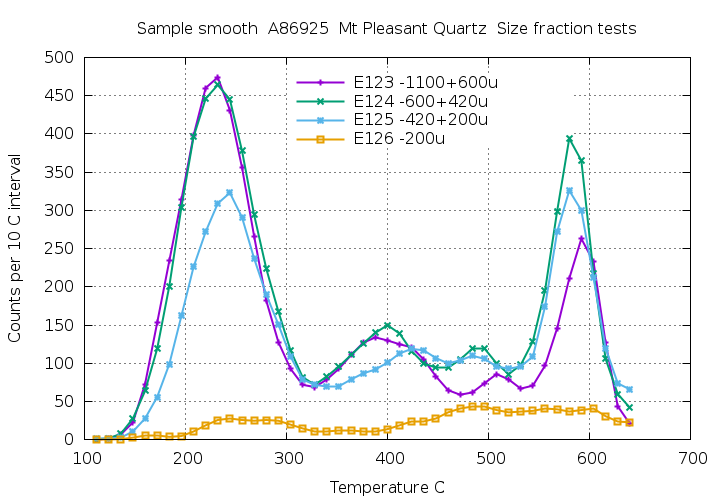
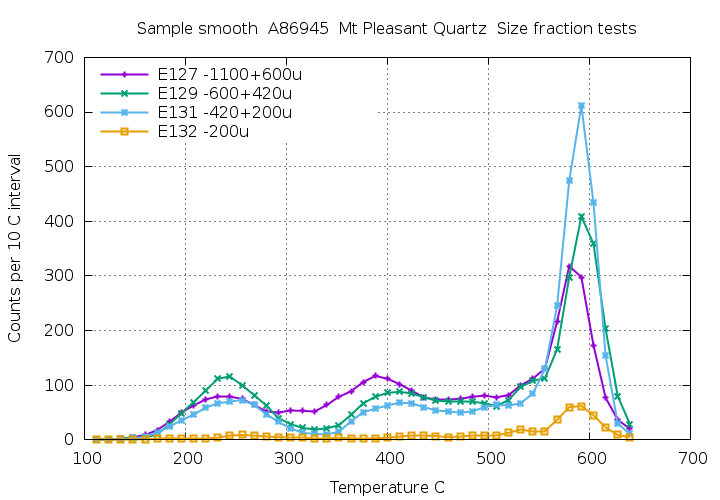
2 samples of quartz from the Mt Pleasant Molybdenum prospect show
that the highest response depends on the fluid inclusion
population and varies for different populations within the same
sample. For the low temperature population in sample A86925, the 2
coarse fractions (purple and green) give the highest response. But
the response of the -420+200 micron fraction (blue) is good and
this fraction usually gives less random fluctuations with
temperature and better reproducibility. In the fine grained
fraction (orange), many fluid inclusions have been destroyed in
the sample preparation and the analytical response is unacceptably
weak.
Andesite
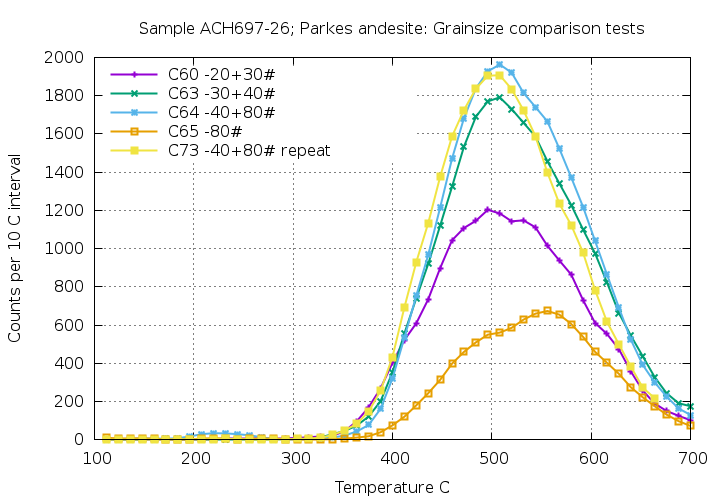
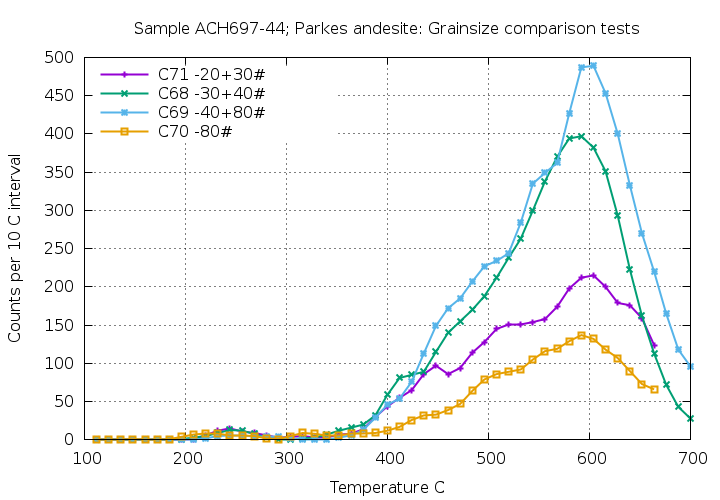
In these andesite samples, the fluid inclusions are probably hosted
in feldspar minerals.The best response is in the -420+200 micron
fraction (-40+80 mesh) (blue curve). The response in the <200
micron fraction (-80mesh) (orange curve) is substantially less. In
sample ACH697-26 the -420+200 micron fraction was analysed twice,
analyses C64 and C73 (blue and yellow), and these duplicate analyses
are in very good agreement and show that variations in the different
grainsize fractions are real and not merely instrumental
reproducibility. The -420+200 micron fraction is the best for
routine analyses.
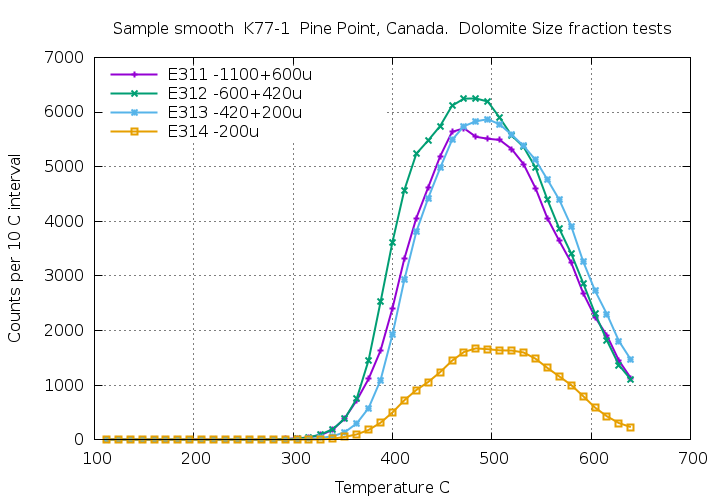
Dolomite
In dolomite, the 3 coarser grainsize fractions give similar
decrepitation intensity, but the -420+200 micron fraction (blue
curve) gives the smoothest (least random noise) plot and is the
best size for routine analyses. The fine grainsize fraction of
<200 microns (orange curve) again shows weak decrepitation due
to destruction of many fluid inclusions during sample preparation.
Conclusions
For routine decrepitation analyses, the best grainsize
fraction is the -420+200 micron fraction. Coarser grainsize
fractions can give useful results, but fine grainsize samples are
unacceptable due to loss of fluid inclusions during sample crushing.
However if you are trying to avoid interference from fluid
inclusions in other analytical experiments then use of fine grained
sample fractions could help.
 Applied Mineral Exploration