Newest
Topics:
For the latest news, see the NEWEST TOPICS page.
Google is too dumb to let me put the list of news in this column and falsely claims that all my pages are self-duplicates.
Google-NONSENSE
Google's so-called "Artificial Intelligence" is an abuse of the concept of intelligence!
Tanami area samples - interpretation with sample location
details
Kingsley Burlinson
Burlinson Geochemical Services
Summary:
These samples were collected from a wide range of deposits and
background
locations throughout the Tanami proterozoic Au province. They were
initially
studied using conventional microthermometry and also laser Raman
analyses,
and then submitted for acoustic decrepitation analysis to see how
the
methods
compared and how fluid inclusion data might help with Au
exploration.
There is an approximate, though imperfect, relationship between
Au
mineralisation
and the presence of CO2-rich fluid inclusions, with
methane-rich
fluid inclusions present in a few areas. The decrepitation
results
are a good, quick indicator of the presence of CO2-rich
fluid
inclusions, without the pain of preparing double polished thin
sections
and undertaking tedious microthermometry. And in at least one
case,
decrepitation
detected the presence of CO2-rich fluids in a sample in
which
the microthermometric method could not be used because the fluid
inclusions
were too small.
In general, low temperature decrepitation below 300 C indicates
CO2-rich
fluids and is a favourable sign for gold mineralisation. The
exceptions
might not be a failure of the method as much as difficulties with
collection
of samples and classification into ore and non-ore suites. The
variations
in decrepitation response suggest that the quartz is zoned
or
banded,
but no samples were collected to check this. Such banding,
if
unrecognized
during sample collection, would seriously interfere with
sample
classification.
Additional work should be done to investigate such banding and
multiple
stage formation of the quartz.
The decrepitation data indicates that in some cases the
microthermometry
was applied to secondary instead of primary inclusions, resulting
in
incorrect
temperature estimates, and possibly also incorrect formation depth
estimates.
If microthermometry is being used in an exploration programme,
decrepitation
data should also be collected to ensure integrity of the data.
One or more samples were reported to
contain
predominantly
methane fluid, and to have formed at a depth of 6 to 8 Km where
the
pressure
was 1500 to 2000 bars. But these samples showed no low temperature
decrepitation.
This is inconsistent with the phase behaviour of methane. In this
case
the decrepitation data shows there is a serious problem with
either the
chemistry or pressure calculations in the microthermometry. These
samples,
from the Groundrush deposit, should be
viewed
with extreme suspicion until additional work to resolve this
discrepancy
is undertaken.
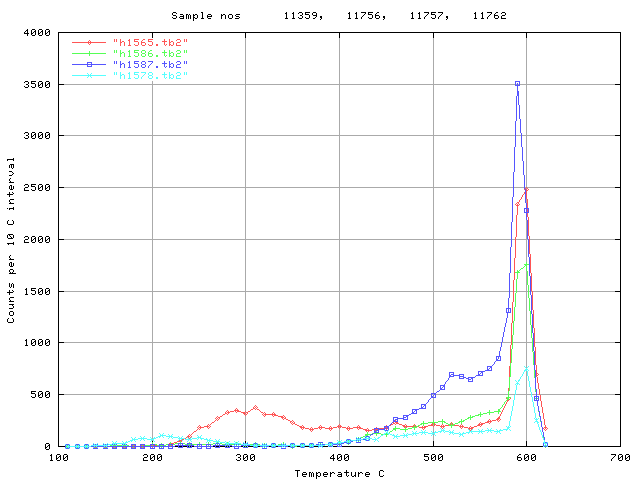
Dead Bullock Soak area.
The Callie mine and Fumarole Pit are part of the "Dead Bullock Soak"
workings.
(Geology & location map).
Of the four ore-related quartz samples, only 2 show the low
temperature
decrepitation typical of CO2-rich fluid inclusions. Note
that
sample 11762 shows this low temperature decrepitation despite all
the
inclusions
being too small for the microthermometric method to be used.
The average Th of 262 C obtained on sample 11359 is
within
the region of CO2-rich inclusion decrepitation. This
temperature
is probably too low as it reflects the inclusions which were
decrepitating
and the microscopist failed to notice this decrepitation!
Sample 11359 has significant CO2 and average Th
262
C, with visible Au.
Sample 11762 has "clusters of small gas rich/gas only inclusions,
no
microthermometry performed", with visible Au.
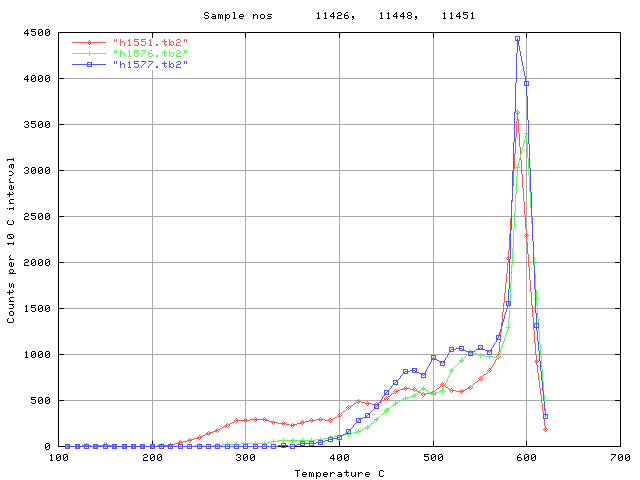
Of 3 presumed non-ore quartz samples, one did show low
temperature
decrepitation
due to CO2-rich fluid inclusions. It is possible that
sample
11426 (shown in red, below) from the fumarole pit is more closely
related
to mineralisation than expected.
The correlation between low temperature decrepitation of CO2-rich
fluid
inclusions and ore is inconsistent in this set of samples.
This may be due to complex growth zoning in the samples or to
difficulty
in identifying the different types of quartz in outcrop. A more
detailed
study of these deposits, together with more careful
microthermometry is
needed to confirm the suspected relationship between Au
mineralisation
and CO2-rich fluid inclusions.
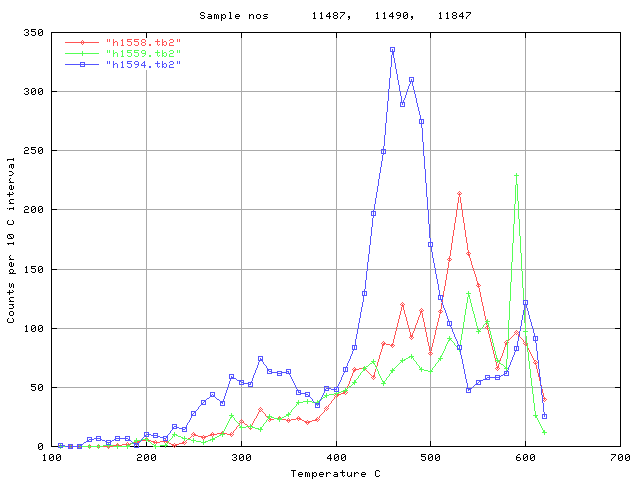
The Bunkers hill pit is at "the granites" mine area, and the Oberon
pit
is near Mt. Ptilotus, about 30 Km. NW.
These 3 samples all have remarkably low decrepitation activity. Low
temperature decrepitation occurs in all of these ore samples, but is
seen
only as a low intensity broad "toe" in the 2 Oberon samples, (red
and
green).
This suggests the mole fraction of CO2 in the inclusions
is
relatively low and/or the deposition occurred at shallow depths.
Sample
11847 (in blue) from Bunkers hill pit at "the granites" area shows
significant
low temperature decrepitation from CO2-rich fluids.
Decrepitation
can provide this information despite the microscopist's comment that
inclusions
in this sample were too small to work with.
H1558 11487
Oberon
602249E
7756335N
Ore stage q vein with visible Au; 11.6 g/t Au
H1559 11490
Oberon
602249E
7756335N
Ore stage q vein with visible Au; 6.5 g/t Au
H1594 11847 Bunkers Hill pit
641500E
7725700N Ore stage q
vein;
~2 g/t Au
Other information reported by Wygralak states that "Sample 11847
has
gas-only inclusions which are too small for microthermometry, 1.7
g/t
Au."
It is not clear why his 2 statements about this one sample have
slightly
differing gold grades. Is this another sample mix-up?
The sample from East Ptilotus shows no low temperature
decrepitation
but had very high gold content. The nearby Oberon samples (see
above)
showed
weak low temperature decrepitation in ore samples. It is not clear
if
this
is a sampling problem, perhaps due to zoned quartz, or an
inconsistency
in the Au - CO2 association.
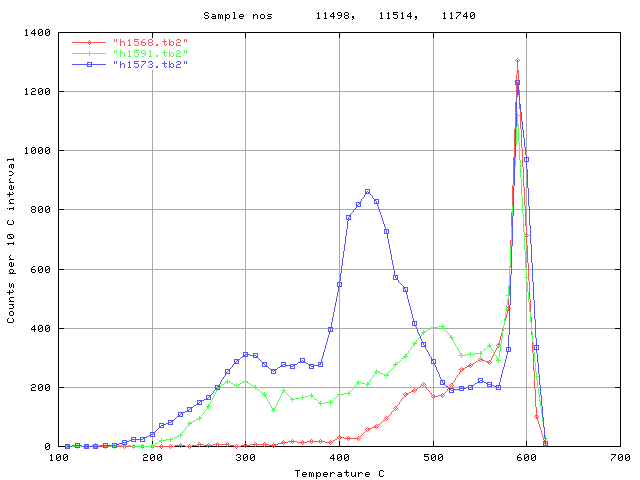
Both of the other mineralised samples are from distant deposits,
but
the prominent low temperature decrepitation confirms the
relationship
between
Au and CO2-rich fluid inclusions in this province. Note
that
the Th on sample 11740 (in blue) from White Range
reflects
the
beginning of the main decrepitation peak at 430 C, and agrees with
an
estimated
Th of about 350 which would be made from the
decrepitation
data.
(Td - 80 C).
( White Range is shown on the geology
map, and Twin Bonanza is approx. 130 Km. WNW of "The
Granites".)
Sample 11740 has CO2-rich inclusions, average Th
322 C , with visible Au.
H1568 11498 East
Ptilotus
621000E
7756000N Ore stage q vein 358 g/t
Au
H1591 11514 Twin
Bonanza*
0520258E 7780530N Ore stage q vein
39.3
g/t
Au
H1573 11740 White
Range
(Arltunga goldfield) 470600E
7407700N
Ore stage q vein; visible Au
Groundrush Mine.
This area is some 150 Km. from "The Granites" and is near the Tanami
gold
mine. (Geology & location
map).
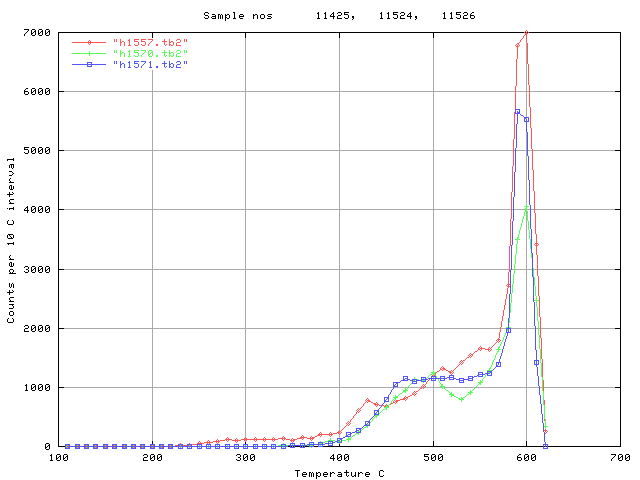
These samples are confused by a sample mis-numbering before reaching
the laboratory, but they all show low or no decrepitation due to CO2-rich
fluid
inclusions. Wygralak claims a depth of deposition of 5.7 to
8.3 Km for this mine and also claims the inclusions are dominated by
methane.
Such inclusions with a high mole fraction of methane and high
internal
pressures due to deep formation, should decrepitate at low
temperature
and the lack of decrepitation on these samples is a major
discrepancy
requiring
explanation. The data are unreliable because of the mis-numbering,
but
it is also possible that the formation depth estimates are
incorrect.
Note
that Wygralak claims the nearby Tanami mine formed at a much
shallower
depth of just 0.4 to 1.8 Km.
The Th of 261 C reported for sample 11526 is too
low
and is probably a measurement of secondary inclusions. The Th
based on the decrepitation data should be approximately 390 C.
There are major problems with the fluid inclusion data and
sampling
at this mine and a complete repeat of this work needs to be
performed
to
untangle this mess.
Sample 11526, Groundrush area, has CH4 + lesser CO2
fluid
inclusions, Th 261 C and visible gold.
Samples 11425 and 11524 are the subjects of a sample numbering
mixup
and the microthermometric data on these samples is
unreliable
and/or
wrong.
H1557 11425 ????????????????
-
Possibly Groundrush ??????? No location information provided.
H1570 11524
Groundrush
(Tanami 1:250K map sheet;
AMG:F604200)
Ore stage q vein; 3.6 g/t Au
H1571 11526
Groundrush
(Tanami 1:250K map sheet;
AMG:F604200)
Ore stage q vein; 9.2 g/t Au
Sample numbering error:
The
geologist
claims 11524 is actually 11424. But this cannot be correct and
perhaps
11425 is actually 11424.
Winnecke Granophyre
This area is 150 Km north ot the Tanami and Groundrush area. (Geology
and location map).
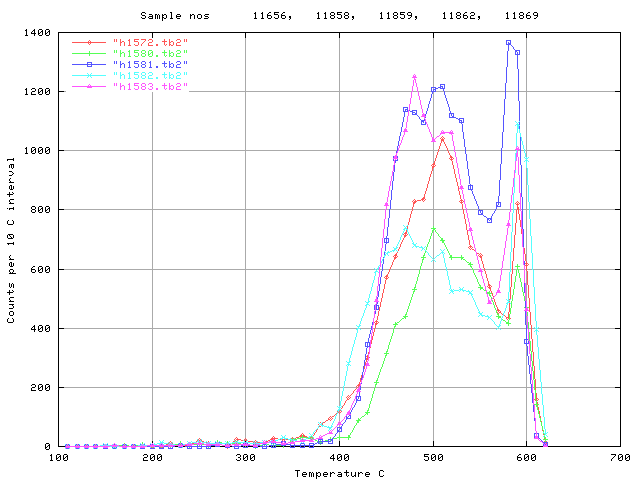
There is no evidence of low temperature decrepitation of CO2-rich
fluid
inclusions in any of these samples. There are 2 different quartz
types recognizable, with 11656 (red) and 11858 (green) having
a
decrepitation
peak at 500 C, while the remaining 3 samples have broader
decrepitation
from 470 to 520 C. The higher temperature decrepitation seems to be
correlated
with the gold bearing samples, except for sample 11862 which has
lower
temperature decrepitation but is thought to be associated with gold.
Wygralak reports Th of
200-220
C on these samples and this is probably data from secondary
inclusions
and an estimate of Th from decrepitation is 390 to 410
C.
His
low formation depth of 0.4 to 0.5 Km may also be incorrect as it
seems
he was observing secondary inclusions.
H1572 11656 Winnecke Granophyre
area*
0617520E 7985795N Ore stage q
vein;
2.0 g/t Au
H1580 11858 Winnecke Granophyre
area
0617527E 7985792N Ore stage q vein
(no
assay
results)
H1581 11859 Winnecke Granophyre
area
0617401E 7985810N Post ore stage q vein
H1582 11862 Winnecke Granophyre
area
0616832E 7985855N Ore stage q vein (no
assay
results)
H1583 11869 Winnecke Granophyre
area
0621103E 7976024N Post ore stage q vein
Background Samples
Pargee Range is about 50 Km NW of the Tanami mine area. This sample
of
barren quartz shows no low temperature decrepitation, and unusually
low
decrepitation intensity overall.
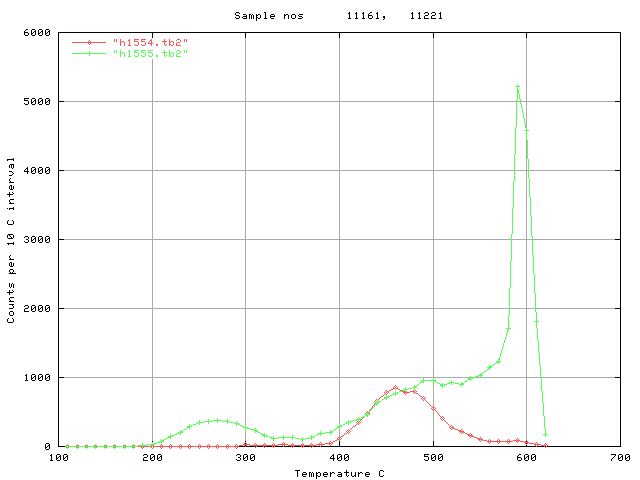
Mt. Davidson is approximately 60 Km. east of "The Granites" mine.
This
sample shows significant low temperature decrepitation due to CO2-rich
fluids,
despite being from a presumed barren quartz. It cannot be
expected that all CO2-rich fluids will result in gold
deposition
and decrepitation is just a way of adding information in the search
for
mineralisation. The CO2-rich fluids indicate a deep
seated
fluid
source for the rock under investigation and this is only an
indirect,
albeit
frequently useful, indicator for gold.
The reported Th of 204 C on the Mt Davidson sample
(11221)
is a measurement within the CO2 peak and is
not
a reliable indicator of the homogenization temperature, which is
probably
about 370 C based on the decrepitation data.
Sample 11221 has CO2-rich inclusions, average Th
204 C.
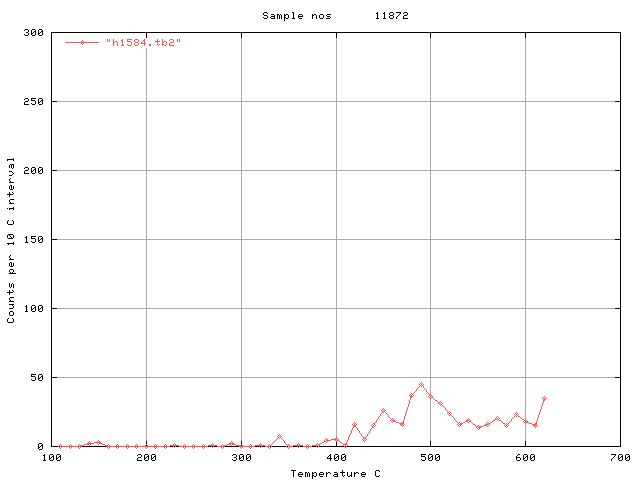
The Antrim Plateau is outside of and far to the north of
the
Tanami
province and is a deliberately remote background sample.
This
quartz
has almost no decrepitation either from a lack of or only very
tiny
fluid
inclusions. It has a response not unlike surficial jasperoid
samples.
This
is clearly not a hydrothermal sample and would not be considered
prospective
in the Tanami geological province.
H1584 11872
0601791E
7857814N Automorphic quartz from geode in
Antrim
Plateau Volcanics
Sample
numbering
error
When the geologist concerned provided sample location information,
it
became
clear there had been a numbering problem. He claims a sample
numbered
11424
was analysed, but no such sample was received at the laboratory. The
geologist
claims that sample 11424 is actually sample 11524 mis-numbered. But
his
sample
descriptions of 11524 and 11424 differ, so this cannot be
correct.
Because the geologist declined to provide any sample information for
13
of the samples the data set is not closed and it is impossible to
deduce
which sample is the one he claims as 11424 with certainty. It is
likely
that the undescribed sample 11425 may actually be 11424, but the
geologist
refuses to resolve this discrepancy.
Consequently I consider that the results
for
samples
11524 and 11425 and 11424 in this report and in the geological
information
the geologist concerned has published
elsewhere
must be considered as unreliable and incorrect.
 Applied Mineral Exploration