Newest
Topics:
For the latest news, see the NEWEST TOPICS page.
Google is too dumb to let me put the list of news in this column and falsely claims that all my pages are self-duplicates.
Google-NONSENSE
Google's so-called "Artificial Intelligence" is an abuse of the concept of intelligence!
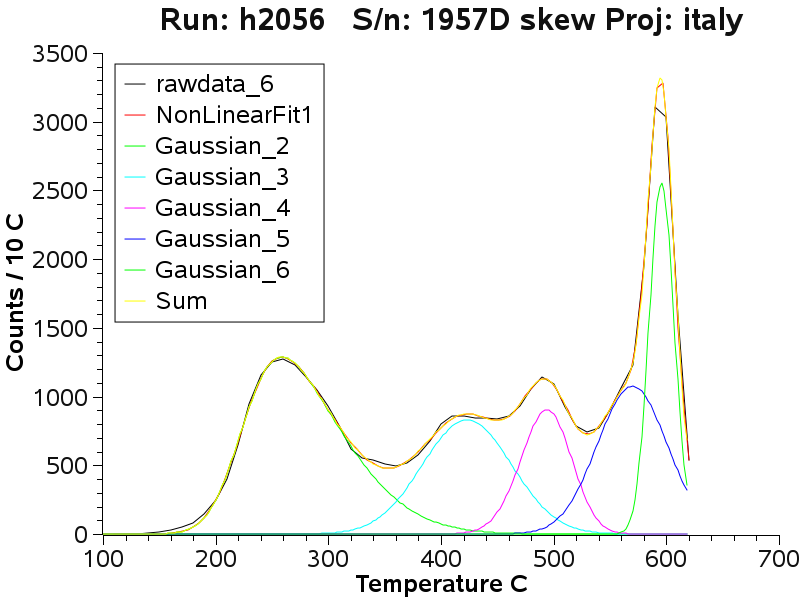
Deconvolution of the Brusson mine data
The decrepitation curves of the Brusson samples show complex shapes and
difficult to use in interpretation. By performing deconvolution of the
curves we can find a subset of population distributions which add
together to give the observed curve. It is then possible to compare
samples using the parameters of the component sub-populations. A complete discussion of the study at the Brusson mine is here.
All of the Brusson samples were deconvolved using a mathematical
software package. Although it is possible to deconvolve the data into
gaussian distribution populations a lower residual error (better fit)
is obtained by using a skewed gaussian distribution. It is reasonable
to expect fluid inclusions populations to be skewed because of the
increased likelihood of decrepitation of inclusions near grain
surfaces. Skew can also be caused by changes in the gas content of
inclusions during entrapment and quartz formation. During curve
deconvolution a degree of user input is helpful to constrain the
mathematics as the solution is not necessarily unique and some
solutions lead to physically unlikely population groupings.
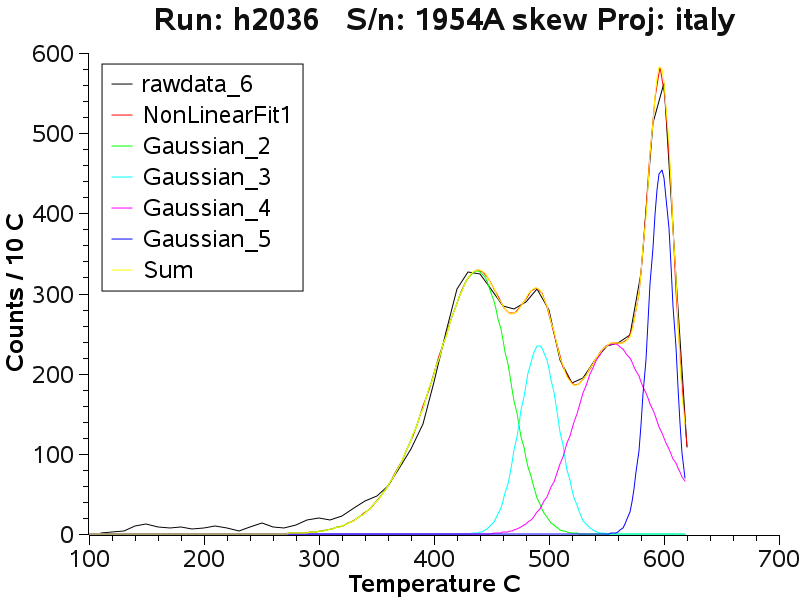
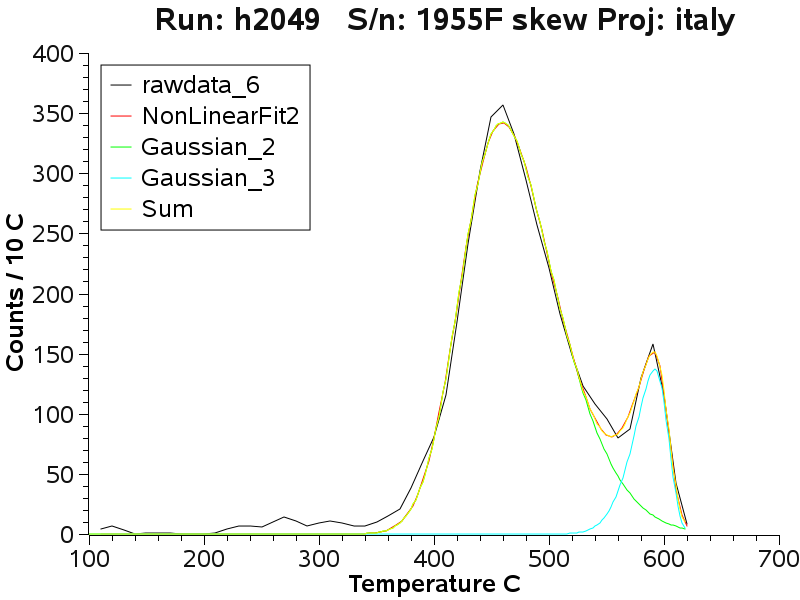
Some of the Brusson deconvolution data is presented here to show how
well the method fits the data. At the completion of each fitting
procedure, the parameters of the various sub-populations are recorded
and used to prepare the tabulation of peak temperatures shown previously.
At the lower adit level a low
temperature decrepitation peak is common, but not always present
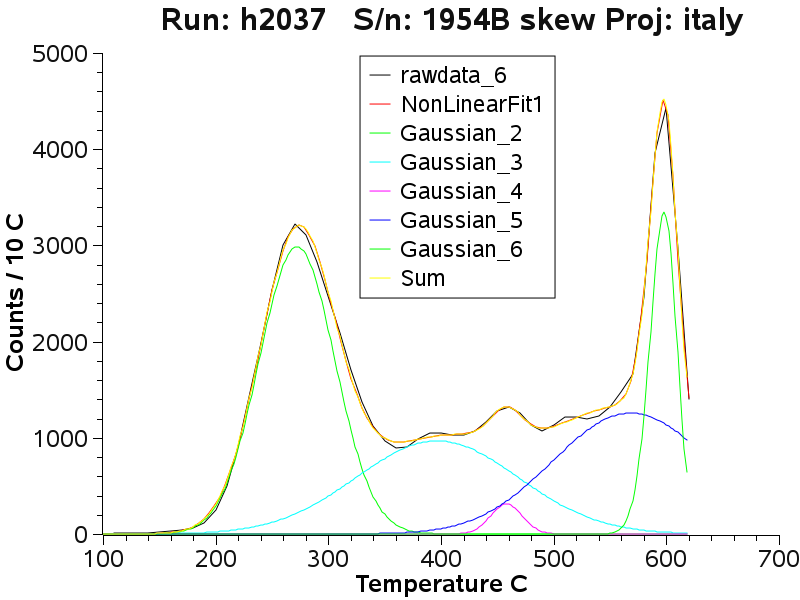
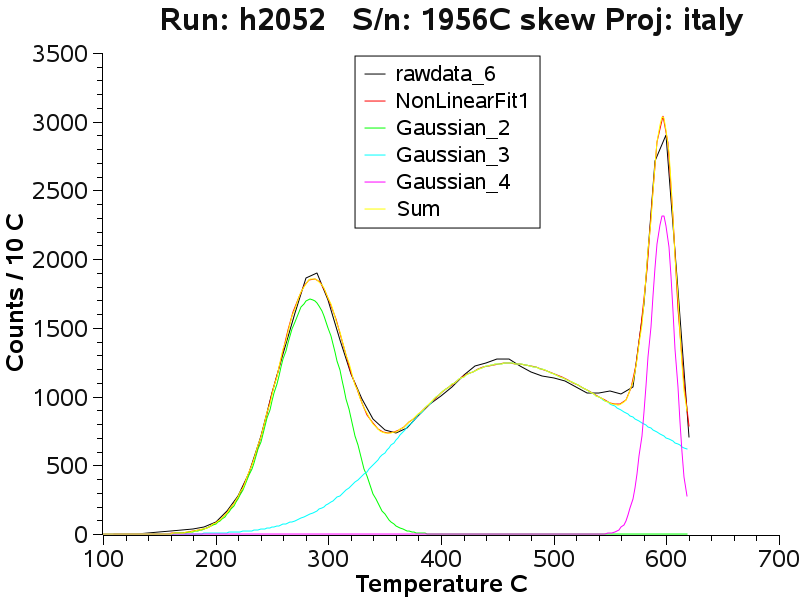
At the mid-level adit, the quartz
varies from complex with multiple populations to simple with only 2
decrepitation peaks.
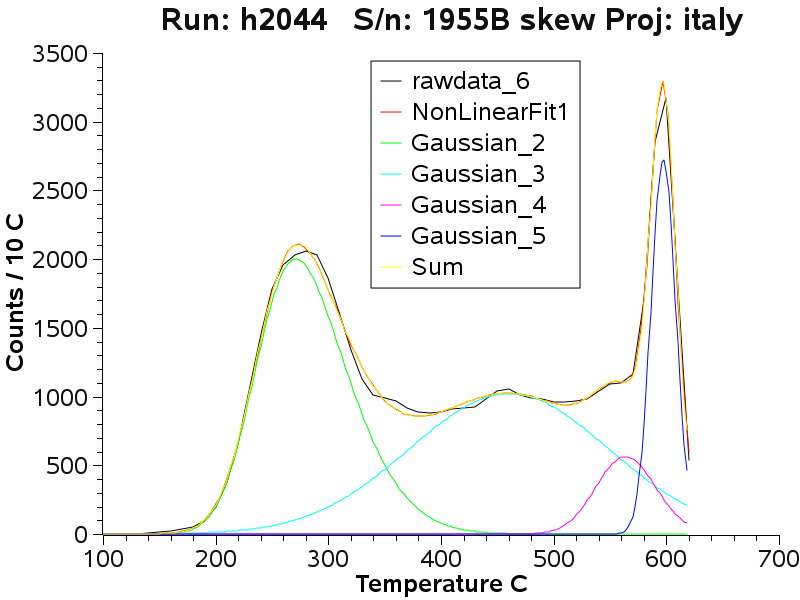
At the upper adit level, low
temperature CO2 caused decrepitation is still prominent.
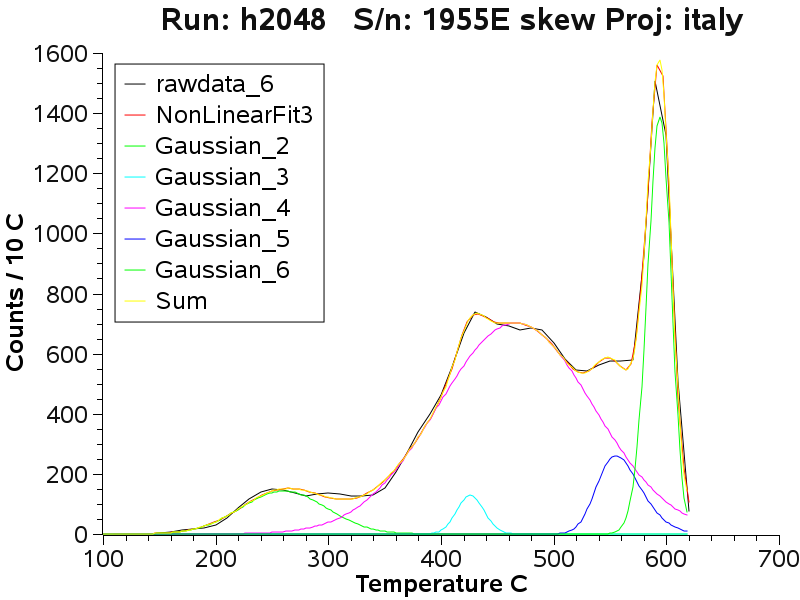
Above the ore zone in carbonate host
rocks, low temperature CO2 caused decrepitation is still present.
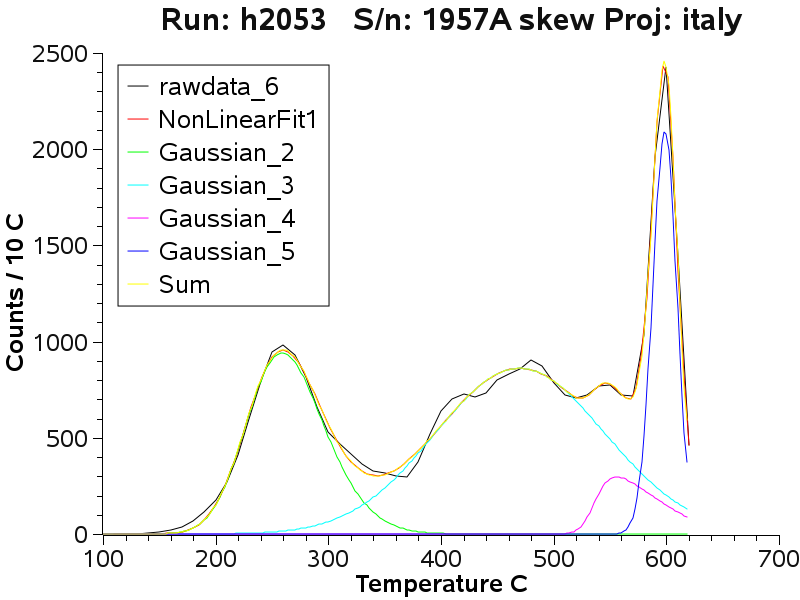
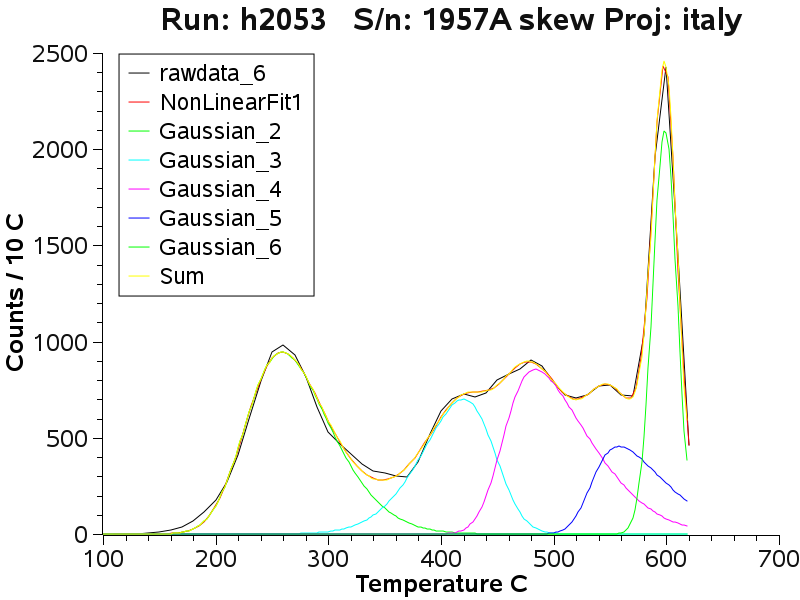
Note that the next 2 graphs are 2 fits to the same sample
data assuming either 4 or 5 sub-populations. The 5 peak fit is slightly
better than the 4 peak fit - but it is difficult to be sure exactly how
many populations are really present in the data. The curve fitting does
not necessarily lead to a unique result. However, multiple fits of the
same data with the same number of assumed populations does lead to
identical sub-population parameters.
Note the complexity of the sample with many fluid inclusion
populations, indicating that this quartz is strongly zoned.
 Applied Mineral Exploration