A talk proposed for the Bern ECROFI conference
(2007)
Acoustic decrepitation as a means of fluid inclusion study was first
used in Canada in the 1950s, and later used extensively in the USSR.
The method avoids the use of microscopes and thin sections by
instead counting acoustic pressure pulses as a sample is heated,
which causes the fluid inclusions to develop high internal pressures
and burst open. It was presumed that the formation temperature of
the fluid inclusions could be ascertained from the temperature of
the beginning of abundant decrepitation events. But these studies
often gave decrepitation temperatures that were far too low and
which conflicted with microthermometrically determined formation
temperatures. Consequently the method was largely abandoned in
western countries, although it was adapted as an exploration
technique and remained in use in the USSR for many years.
This early demise of the method in western countries was primarily
due to a lack of understanding of the importance of CO2
rich fluid inclusions in mineralising fluids as well as lack of
understanding of the decrepitation effect of such non-condensable
gases during sample heating. With our present understanding of the
importance of CO2 in ore forming fluids and our much
improved thermodynamic understanding of multi-phase fluid
inclusions, we now realise that the early criticisms of the method
were at least inappropriate if not actually incorrect. It is
therefore necessary to reconsider the method, particularly with a
view to its use as a rapid analytical technique for mineral
exploration.
Discussion
Because aqueous inclusions condense, forming a liquid phase when
they cool, they will not develop high internal pressures upon
re-heating until quite high temperatures, at least above their
homogenisation temperatures and relatively close to their formation
temperatures. But CO2 fluids do not condense as they
cool, retaining high internal pressures. And from the gas law, it is
clear that such CO2 rich fluid inclusions will quickly
develop high internal pressures at low temperatures as they are
heated, resulting in decrepitation well below their formation
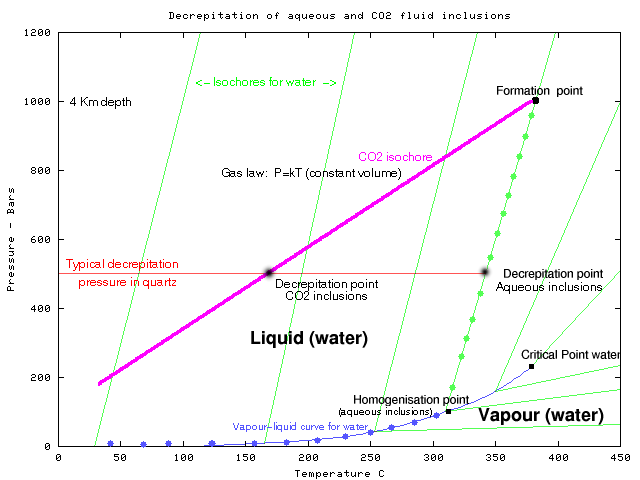
temperatures. These relationships are shown in Fig 1 which compares
a pure H2O inclusion with the PT behaviour of a pure CO2
inclusion of the same formation P and T. Although inclusion
decrepitation depends on many variable such as shape and size as
well as pressure, we can assume that decrepitation will occur when
the inclusion overpressure is some 500 bars. Because P increases
linearly with T in the CO2 inclusion, this pressure is
reached at temperatures as low as 200 C, resulting in decrepitation
at a temperature well below the formation temperature. In contrast,
the aqueous inclusion contains a liquid and vapour phase at room
temperature and will not develop high internal pressures until after
it homogenises. The internal pressure then rises linearly with
temperature along its isochore, but will still not develop high a
high pressure and decrepitate until the temperature is close to the
formation temperature.
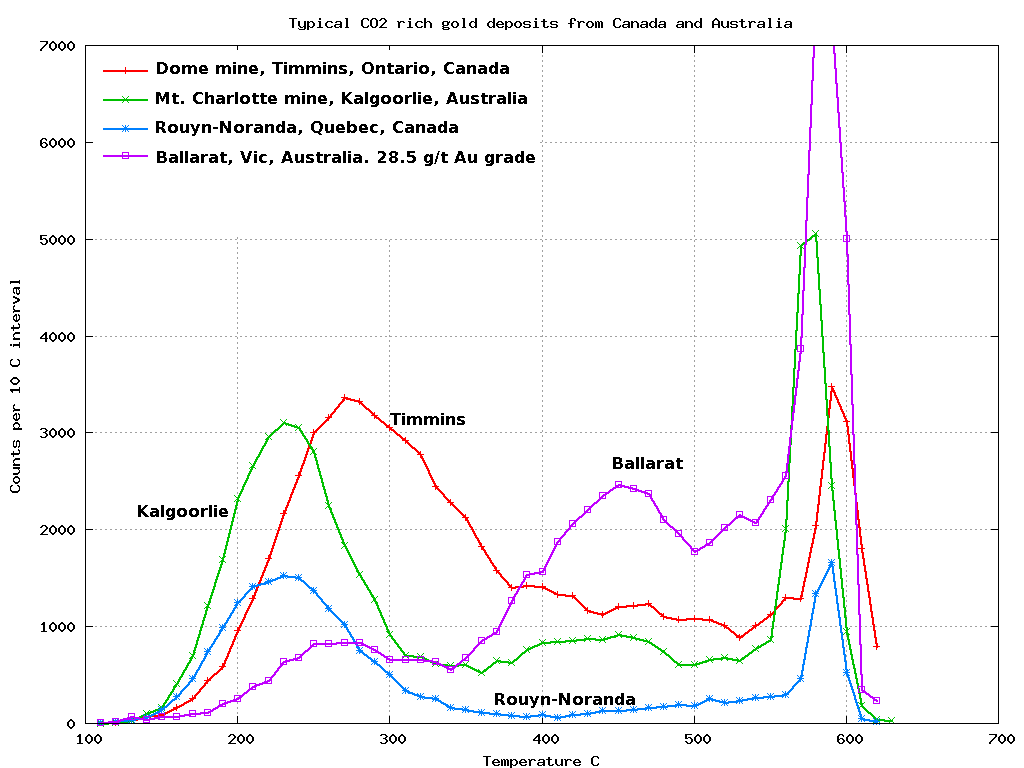
Although this behaviour is a hindrance in determining formation
temperatures on inclusions which contain CO2, it means
that decrepitation data can easily be used to detect CO2
rich inclusion populations, which is very useful in mineral
exploration for Au deposits because of the commonly documented
association between Au and CO2 rich fluids. (Fig 2) Other
gases such as CH4 behave just like CO2 and so
they contribute to this low temperature decrepitation effect. Plots
of the equation of state for various gases show that they all result
in high inclusion pressures and low temperature decrepitation.
Statements by some authors that CH4 does not cause fluid
inclusion decrepitation are incorrect and contradict the gas law.
Fig. 1 P-T comparison for CO2 and H2O
inclusions and their decrepitation behaviour under heating.
Fig. 2 Gold mineralised samples frequently have high CO2
fluids with intense low temperature decrepitation.
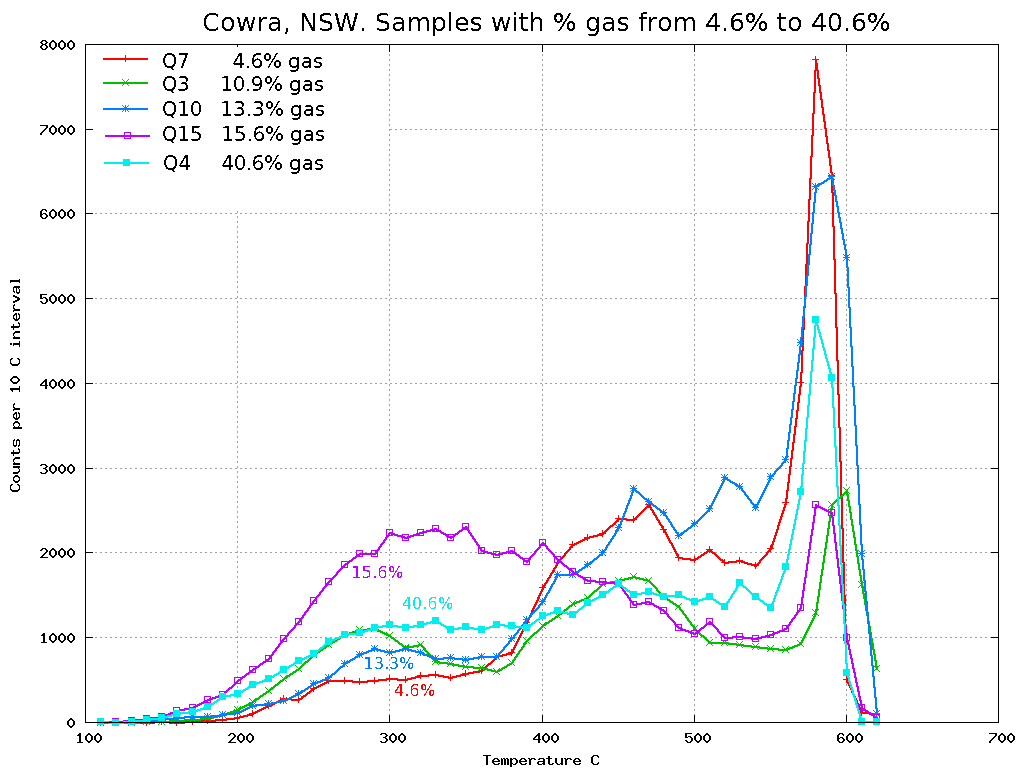
Because mixtures of CO2 and H2O fluids show
immiscibility at the temperatures and pressures relevant to
decrepitation, the behaviour of such inclusions is essentially the
same as if the inclusions were comprised merely of CO2.
It is therefore not necessary to become excessively concerned with
the behaviour of CO2 - H2O mixtures. The
overall decrepitation behaviour is to decrepitate at low
temperatures just like the pure CO2 inclusions. Samples
from the Cowra goldfields in NSW, Australia (Fig. 3), show that even
samples with combined CO2 + CH4 contents as
low as 5% give rise to significant low temperature responses in
decrepigrams. (Mavrogenes et. al., 1995)
Fig. 3 Mixed phase CO2 - CH4 - H2O
fluid inclusions still give prominent low temperature decrepitation
peaks
Schmidt-Mumm (1991) asserted that sounds measured in decrepitation
experiments were dominated by crystallographic and grain boundary
effects. This is incorrect as the instruments measure a pressure
pulse in the volumetrically large air column between the sample and
sensor. Changes in crystal structure or grain boundary movements
simply cannot generate large enough pressure pulses to be detected.
Only the rupture of fluid inclusions with subsequent release of high
pressure gases or a steam explosion from superheated water can
generate the pressures necessary for detection. Shear waves generated by the crystallographic
changes cannot be transmitted through fluids and are not measured
in this instrument. Low temperature secondary inclusions are a
common problem in microthermometric studies, but decrepitation data
does not show peaks which relate to such secondary inclusions. This
is thought to be because secondary inclusions either leak gradually
or open at low temperatures and thereby fail to generate
sufficiently large pressure pulses to be detected. Consequently
baro-acoustic decrepitation side-steps the entire problem of
secondary inclusions and their potential mis-identification.
Bodnar et. al. , 1989, compiled data which shows that most fluid
inclusions can survive very high internal overpressures and that
only the largest inclusions (>25 microns) decrepitate at internal
pressures less than 1 Kbar. This seems to be at odds with the
observed behaviour of samples analysed by baro-acoustic
decrepitation, which often have 50,000 to 500,000 total
decrepitation counts per gram when heated from 100 C to 620 C. To
investigate this, fluid inclusion abundances were counted
microscopically and compared with decrepitation analyses of the same
samples. This showed that even samples with no inclusions larger
than 20 microns can give significant decrepitation. It is likely
that some small inclusions do decrepitate and this probably reflects
complex factors such as the proximity of the inclusion to nearby
fractures and the shape of inclusions which gives rise to stress
concentrations at sharp points. Typically, only some 0.5% of
inclusions larger than 8 microns across decrepitate and are detected
during analysis. A full discussion
of this is here. Despite the low decrepitation percentages,
replicate analyses of aliquots of the same sample give consistent
and reliably reproducible results, as shown by many years of
replicate analyses of the same standard samples in the laboratory.
All of this data was measured on the BGS
model 105 decrepitometer in Darwin, Australia (Burlinson,
1988). However there is another operating decrepitometer of
completely different electrical design, being analogue rather than
digital in nature. That instrument is used by Prof. Xieyihan in
Beijing. When Xieyihan used his instrument to analyse our laboratory
calibration standard sample, his
result was almost identical to that from our instrument,
confirming that the baro-acoustic decrepitation does indeed
consistently measure the fluid inclusion populations in the samples,
and that the results are independent of the equipment used or the
operator.
Conclusions
Baro-acoustic decrepitation has been incorrectly maligned and
although it is not a high precision method, it gives consistently
reproducible fluid inclusion population temperatures and an
indication of CO2 + CH4 gas contents. As it is fast and cheap it is
ideal for use in mineral exploration where large numbers of samples
can be analysed to determine spatial patterns of inclusion types and
abundances or for preliminary scanning in conjunction with
conventional microthermometric studies.
References
Bodnar R.J., Binns P.R. and Hall D.L., 1989. Synthetic fluid
inclusions – VI. Quantitative evaluation of the decrepitation
behaviour of fluid inclusions in quartz at one atmosphere confining
pressure. J. Metamorphic Geol., 7:229-242.
Burlinson K., (1988). An instrument for
fluid inclusion decrepitometry and examples of its application.
Bull. Mineral. 111, 3-4, 267-278.
Mavrogenes J.A., Bodnar R.J., Graney J.R.,
McQueen K.G. and Burlinson Kingsley, 1995. Comparison of
decrepitation, microthermometric and compositional characteristics
of fluid inclusions in barren and auriferous mesothermal quartz
veins of the Cowra Creek gold district, New South Wales, Australia.
Journal of Geochemical Exploration, 54: 167-175.
Schmidt-Mumm A. (1991) Low frequency acoustic emission from quartz
upon heating from 90 C to 610 C. Phys Chem Minerals. 17:545-553.
 Applied Mineral Exploration