Newest
Topics:
For the latest news, see the NEWEST TOPICS page.
Google is too dumb to let me put the list of news in this column and falsely claims that all my pages are self-duplicates.
Google-NONSENSE
Google's so-called "Artificial Intelligence" is an abuse of the concept of intelligence!
Baro-acoustic
decrepitation
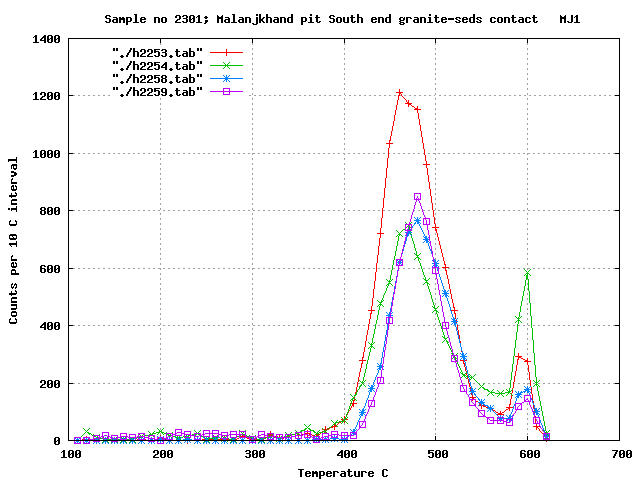
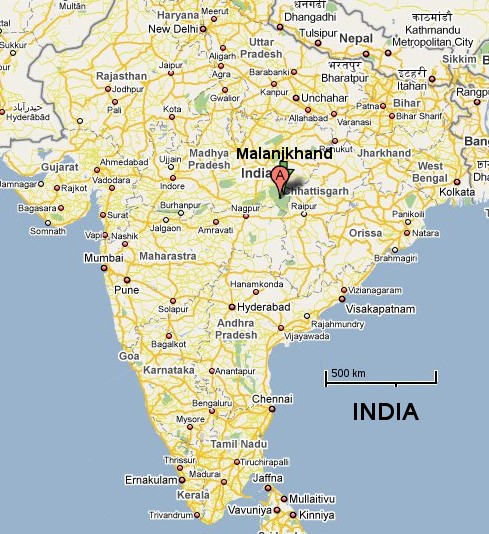
study of the Malanjkhand Cu mine, Central India
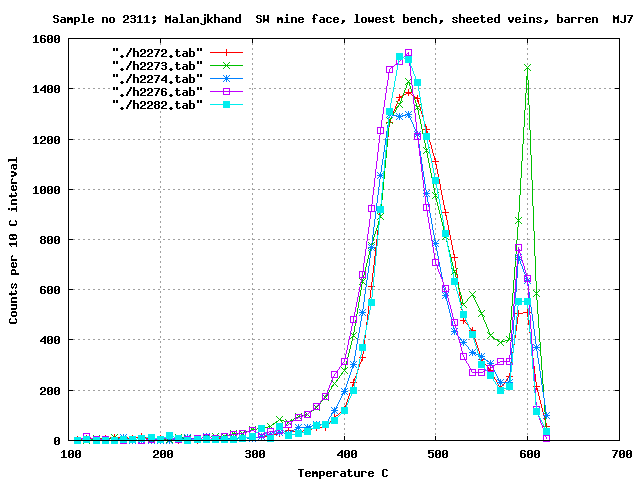
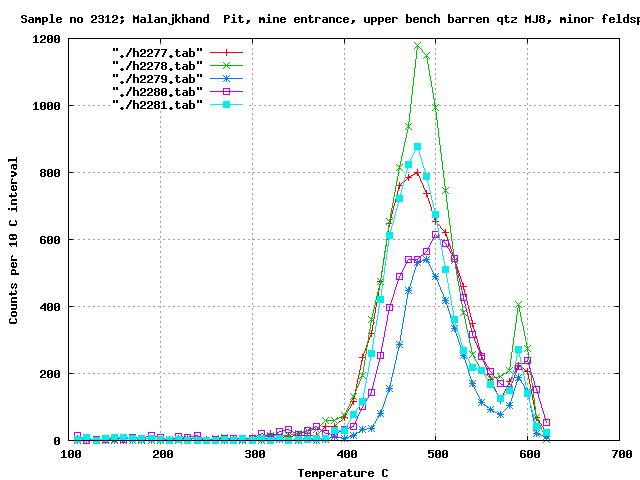
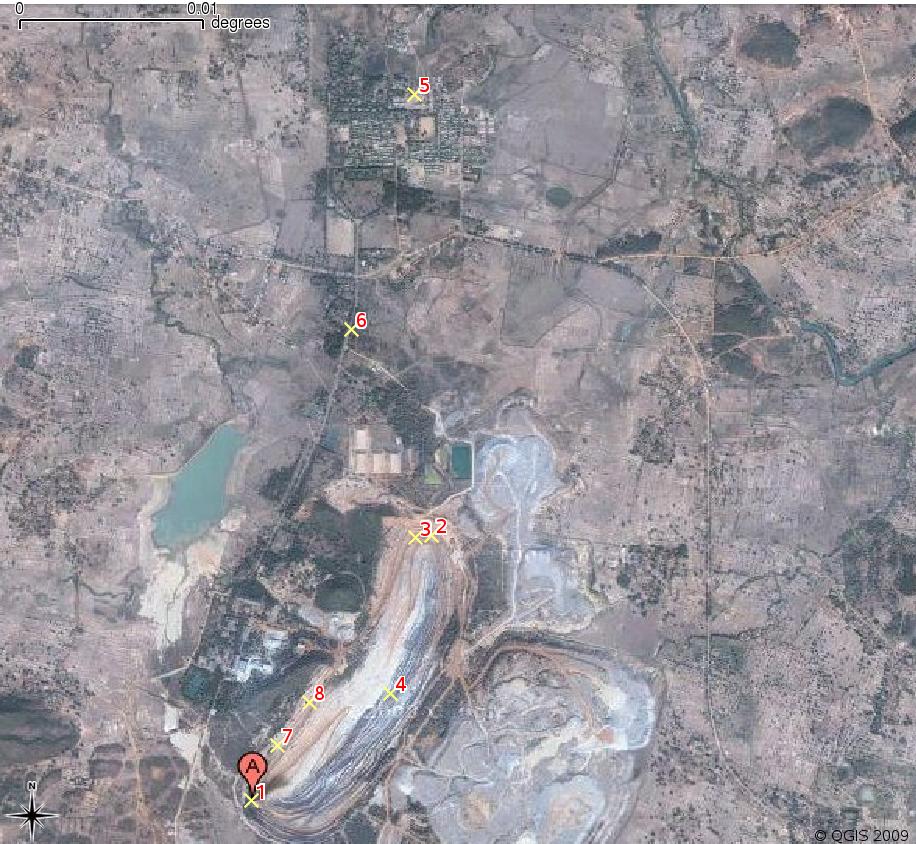
58 samples were collected from the Malanjkhand Cu deposit and
nearby background areas.
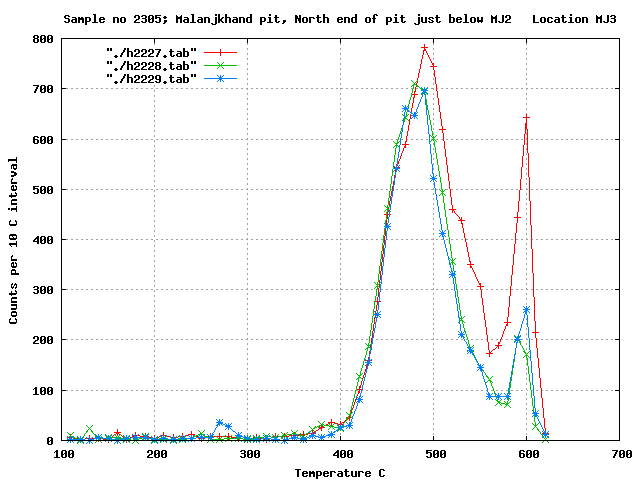
Interpretation
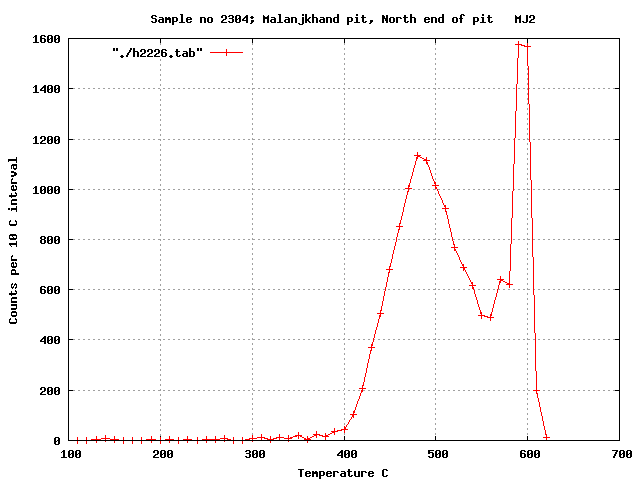
None of these samples show a low temperature decrepitation peak
near 300 C and it is concluded that this fluid system had very low
or
no CO2 and was comprised of just aqueous
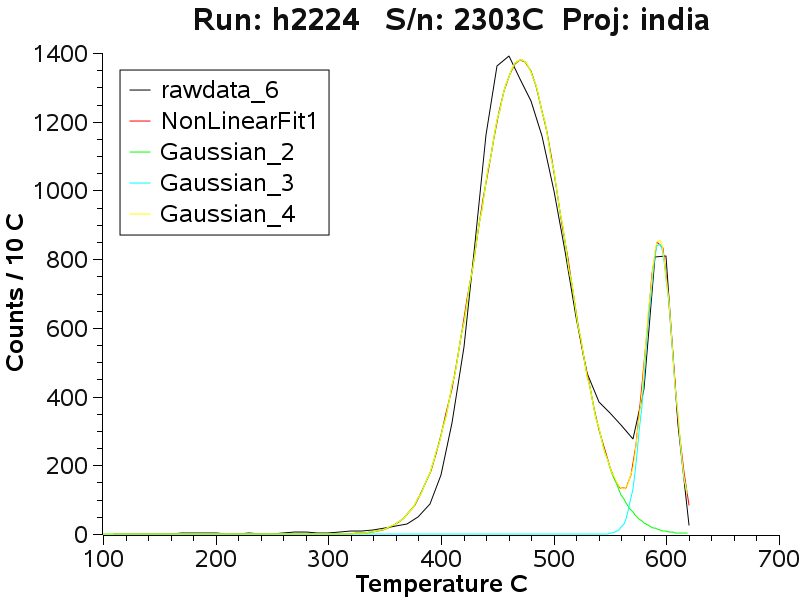
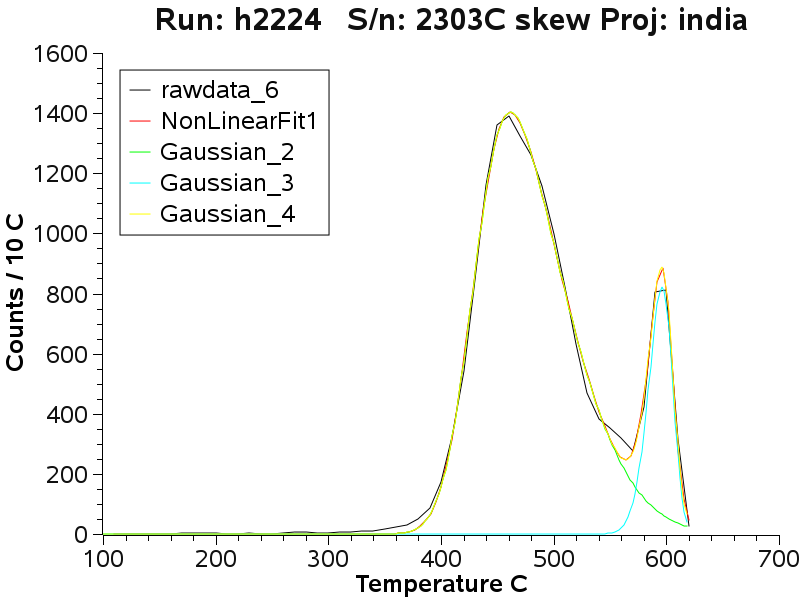
fluids. Each
decrepitation result was mathematically reduced to its component
gaussian distributions to provide a precise way of measuring the
peak
temperature of each result. For most samples, skewed gaussian fits
provided the best fit to the observed data curves.
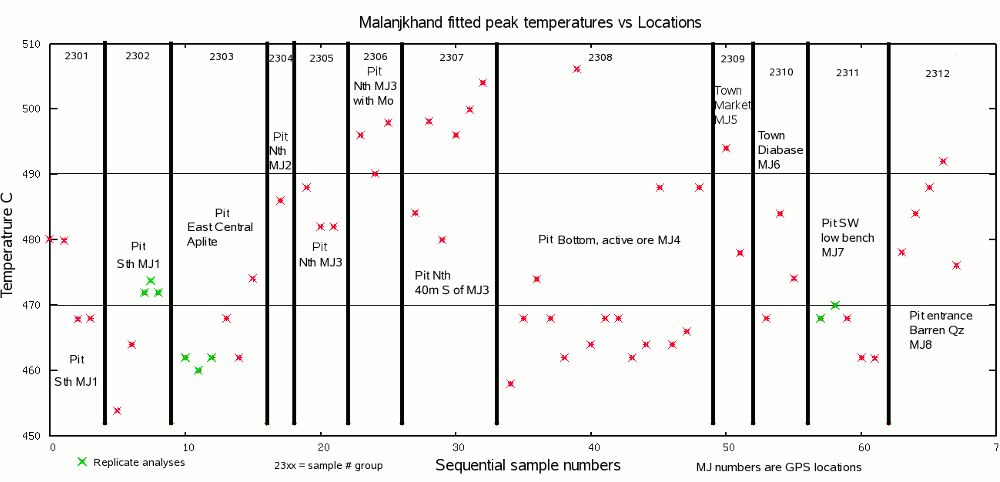
The samples were compared using the fitted temperature of the
decrepitation peak in the temperature interval from 450 C to 510
C. This shows there are consistent temperature differences across
the pit
and between mineralised and barren samples within and near the
pit.
These temperatures are plotted against sample location and
mineralisation type below.
Baro-acoustic decrepitation provides a means of measuring subtle
temperature differences within the mineralising fluid system and
could
be useful in evaluating nearby mineralisation potential.
Summary Results Table
Data
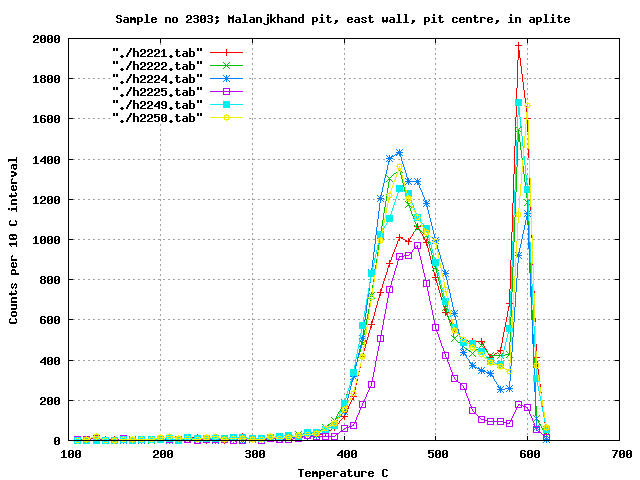
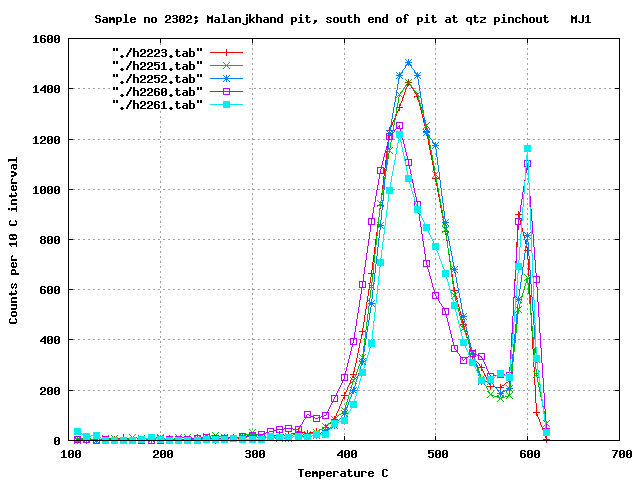
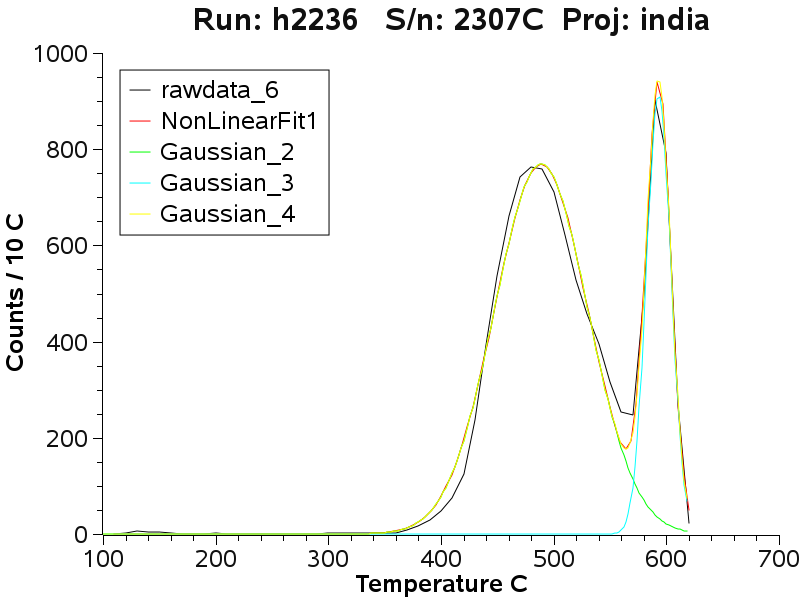
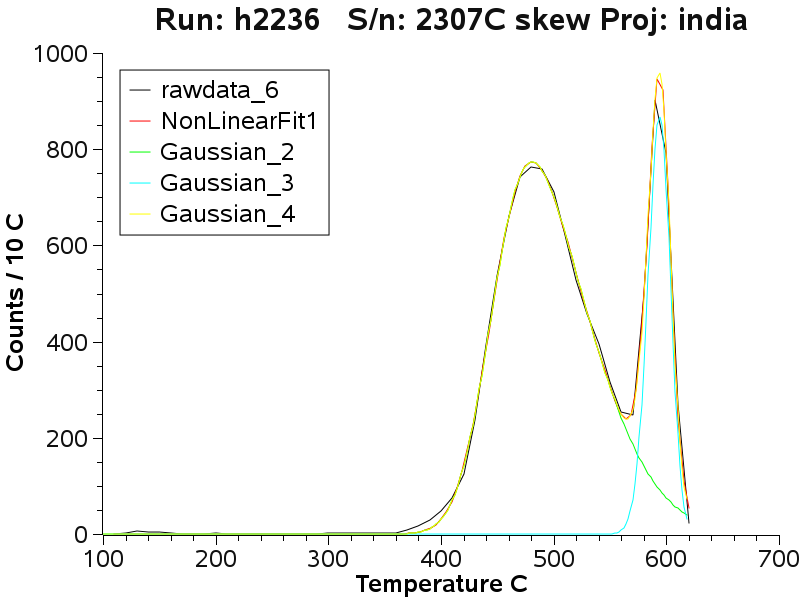
Skew versus Gaussian fits to the data
The following 2 pair of plots show the fitting of mathematical
curves to the raw data. In most cases, the best fit is provided by
using a skewed gaussian distribution. Once fitted, the temperature
of
the best fit peaks can be precisely measured and used for
inter-sample
comparison.
 Applied Mineral Exploration